Posts are below. Jump to the post list ↓

Posts are below. Jump to the post list ↓

Filter posts by category

Data Visualizer template walkthrough – TSV columns, examples, and a validation checklist

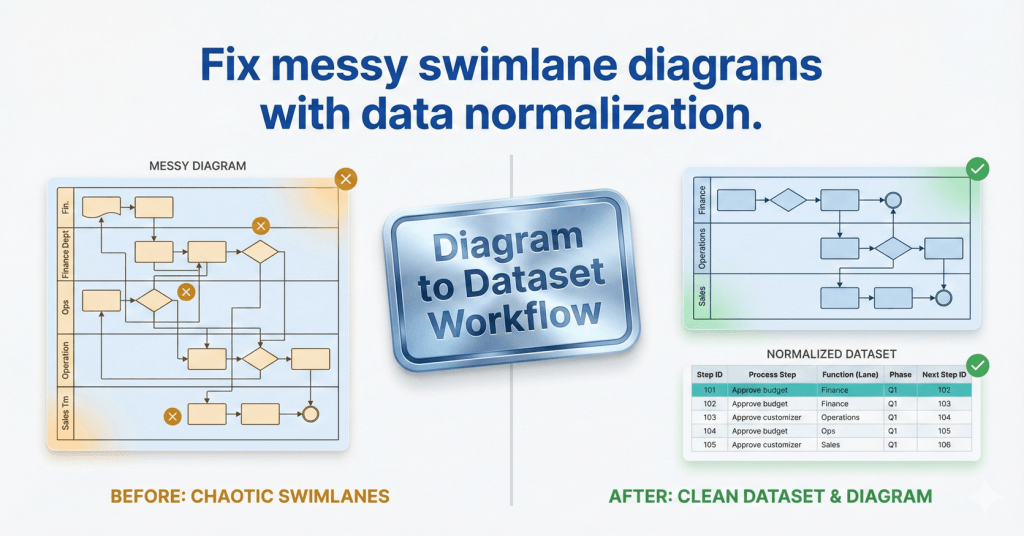
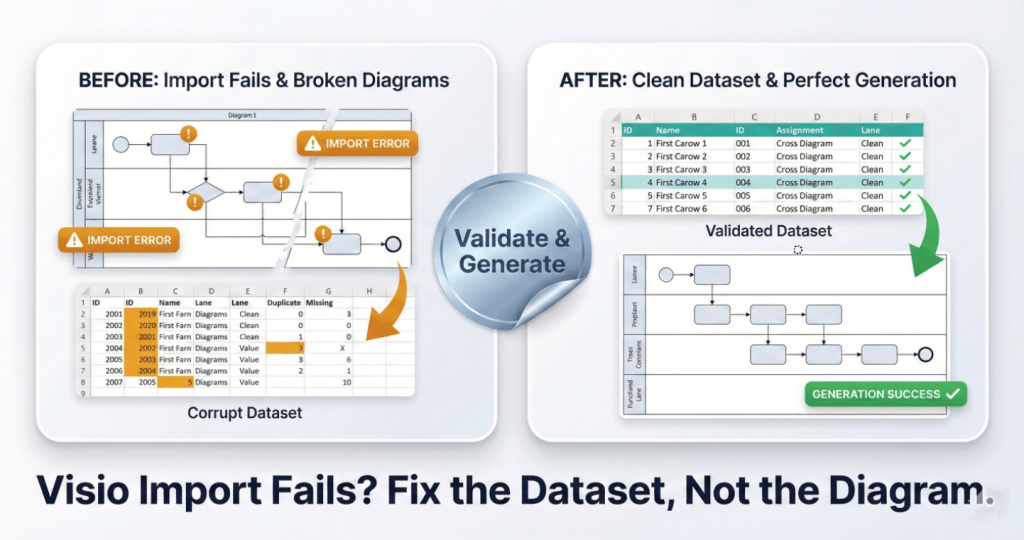
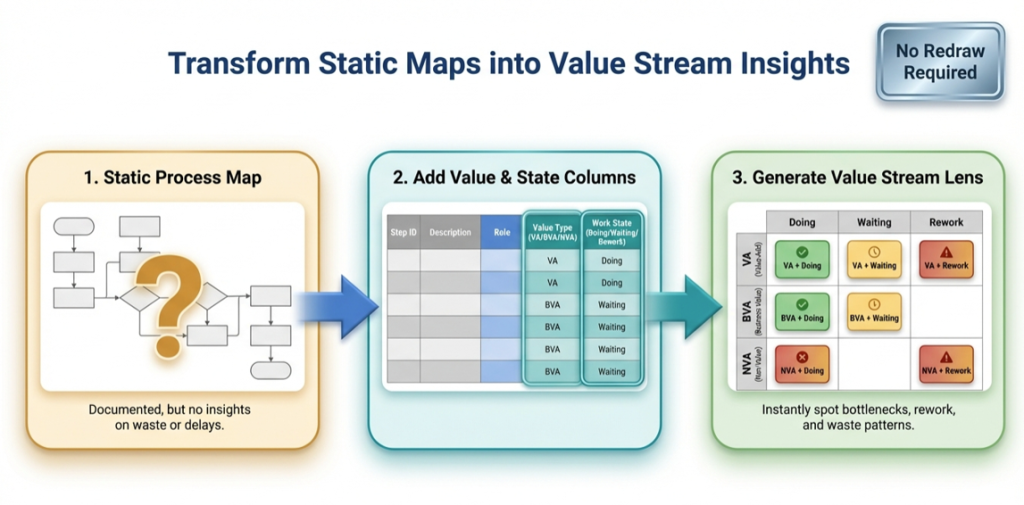
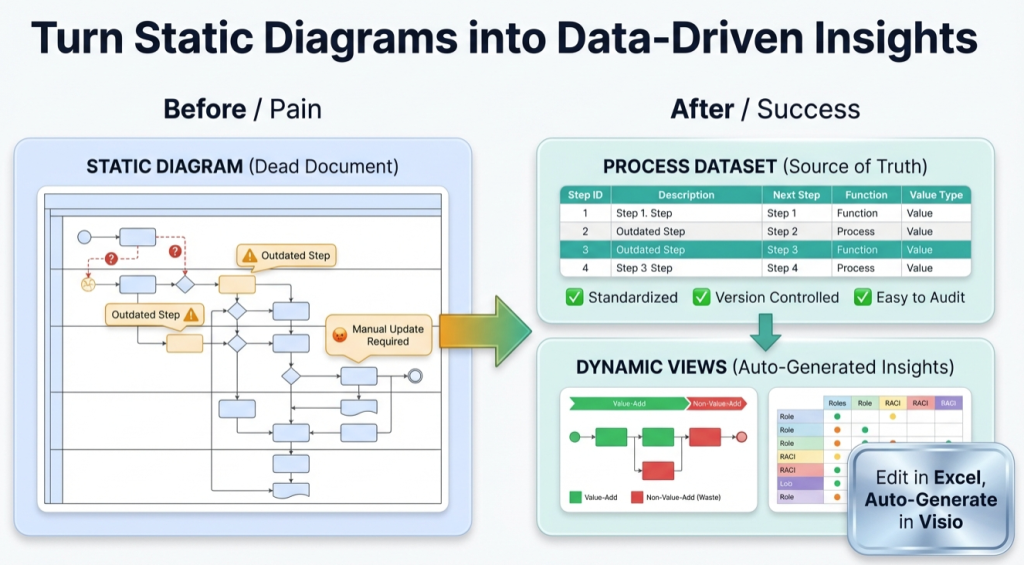
Data Visualizer is strict because it is an importer. This walkthrough explains each TSV column, shows a minimal example, and provides a validation checklist that prevents most import failures.

Data Visualizer template walkthrough – TSV columns, examples, and a validation checklist Read More »

, , , , , , ,

Visio to Excel vs Visio to dataset – why “export” is not enough

“Visio to Excel” often means “make this process analyzable and maintainable.” This guide explains export vs dataset, when each is appropriate, and the clean dataset-first workflow.

Visio to Excel vs Visio to dataset – why “export” is not enough Read More »

, , , , , , ,

Data Visualizer import errors – top causes and exact fixes

If Visio Data Visualizer rejects a dataset, the cause is usually separators, headers, IDs, branching syntax, or hidden characters. Use this checklist to fix imports quickly and keep refresh cycles stable.

Data Visualizer import errors – top causes and exact fixes Read More »

, , , , , , ,

Swimlane Diagram vs Cross Functional Flowchart: What’s the Difference?

These terms are often used interchangeably, but the best choice depends on your audience and use case. This guide explains when each diagram type is appropriate and how to generate both from the same Data Visualizer dataset.

Swimlane Diagram vs Cross Functional Flowchart: What’s the Difference? Read More »

, , , , , , , , ,
comparison graphic titled "Fix messy swimlane diagrams with data normalization." The left side shows a chaotic, unorganized cross-functional flowchart marked with amber warning signs, labeled "Before: Chaotic Swimlanes." The right side displays a clean, structured data table and a perfectly aligned flowchart marked with green success checks, labeled "After: Clean Dataset & Diagram." A central metallic badge reads "Diagram to Dataset Workflow.

Swimlanes as Data: Normalize Function Data (Post 2)

Swimlane diagrams break when lane names drift. This guide shows how to normalize Function values with a canonical lane list, alias mapping, and Excel validation so Data Visualizer imports stay predictable and measurable.

Swimlanes as Data: Normalize Function Data (Post 2) Read More »

, , , , , , , , ,
A square split-screen comparison graphic with a premium metallic trading-card finish. The bottom headline reads "Visio Import Fails? Fix the Dataset, Not the Diagram." The left card, labeled "BEFORE: Import Fails & Broken Diagrams," shows a "Corrupt Dataset" table with amber error highlights and a broken, glitchy flowchart diagram marked with "IMPORT ERROR" warning badges. A central shiny silver foil sticker reading "Validate & Generate" acts as a bridge to the right side. The right card, labeled "AFTER: Clean Dataset & Perfect Generation," displays a clean "Validated Dataset" table with green checkmarks and a perfectly generated, organized flowchart labeled "GENERATION SUCCESS."

Swimlanes as Data: The Function Field (Post 1)

In Visio Data Visualizer, swimlanes are not drawn. They are assigned from the Function field in your dataset. This guide shows how to map lanes correctly, keep names clean, and regenerate swimlane views without diagram surgery.

Swimlanes as Data: The Function Field (Post 1) Read More »

, , , , , , , , ,
infographic titled “Visio Diagram to Excel: 3 Outputs People Expect.” At the top, a simple diagram icon labeled “Diagram” points to a table icon labeled “Dataset.” Below are three side-by-side panels. Panel one, “Data Visualizer Dataset,” shows a table icon and explains that structured data includes shape properties, connectivity, and hierarchy, enabling two-way synchronization. Panel two, “Audit-Ready Table,” shows a clipboard icon and describes a comprehensive, verifiable report with unique identifiers, attributes, and timestamps for traceability. Panel three, “Inventory/Register,” shows a checklist icon and describes a detailed asset list with metadata such as model numbers, locations, and status. At the bottom, a dataset icon points to a regenerated diagram icon, indicating the dataset can recreate the diagram.

Visio Diagram to Excel: What People Mean…

“Convert Visio to Excel” is ambiguous. This guide breaks down the real meanings, shows the right output for each, and explains why a Data Visualizer-ready dataset is often what people actually need.

Visio Diagram to Excel: What People Mean… Read More »

, , , , , , , , ,
infographic showing a workflow titled “One Process Model. Many Strategic Views.” On the left, an Excel-like process dataset table feeds into a central “Strategic Lenses” box containing icons for RACI (Responsible, Accountable, Consulted, Informed), Automation, Risk, Systems, and CX (Customer Experience). Blue arrows extend from the center to the right, where five simplified diagrams illustrate different views: RACI responsibilities, automation levels (manual, assisted, automated), risk indicators, connected systems, and customer experience touchpoints. A “Works with Microsoft Visio” badge appears near the top.

One Process Model, Many Views (Pt. 3 of 3)

Stop redrawing process maps. Maintain one dataset, render diagrams as views, and generate lens-based variants (value stream, governance, systems, automation) by reclassifying fields in the table.

One Process Model, Many Views (Pt. 3 of 3) Read More »

, , , , , , , , ,
infographic titled ‘Transform Static Maps into Value Stream Insights.’ It shows a three-step flow from left to right: (1) a static process map with a question mark, labeled as documented but lacking insight; (2) a table adding value type (value-added, business value-added, non-value-added) and work state (doing, waiting, rework); and (3) a color-coded value stream lens matrix highlighting bottlenecks, waiting, rework, and waste. A badge in the top right reads ‘No Redraw Required

The Value Stream Lens (Pt. 2 of 3)

A maintainable value stream map starts as a dataset. Learn how to classify steps (VA/BVA/NVA) and time modes (Active/Waiting/Rework), then render the lens in Visio Data Visualizer and quantify it in Excel.

The Value Stream Lens (Pt. 2 of 3) Read More »

, , , , , , , , ,
infographic titled ‘Turn Static Diagrams into Data-Driven Insights.’ On the left, a ‘Before / Pain’ section shows a cluttered static process diagram labeled ‘Static Diagram (Dead Document)’ with warning icons, outdated steps, question marks, and a note reading ‘Manual Update Required.’ In the center, a large green arrow points right. On the right, an ‘After / Success’ section shows a clean ‘Process Dataset (Source of Truth)’ table with step IDs and descriptions, checkmarks for standardized, version-controlled, and easy-to-audit processes, and a ‘Dynamic Views’ panel displaying value-add versus non-value-add flow and role responsibility charts. A callout reads ‘Edit in Excel, Auto-Generate in Visio.’ The overall message contrasts manual, outdated diagrams with automated, data-driven process insights.

Turn a Process Diagram Into Process Data (Pt. 1 of 3)

Part 1 shows how to convert a process diagram into a structured dataset, import it into Visio Data Visualizer, and prove the round-trip so the model stays maintainable.

Turn a Process Diagram Into Process Data (Pt. 1 of 3) Read More »

, , , , , , ,
Scroll to Top