
Visio Data Visualizer
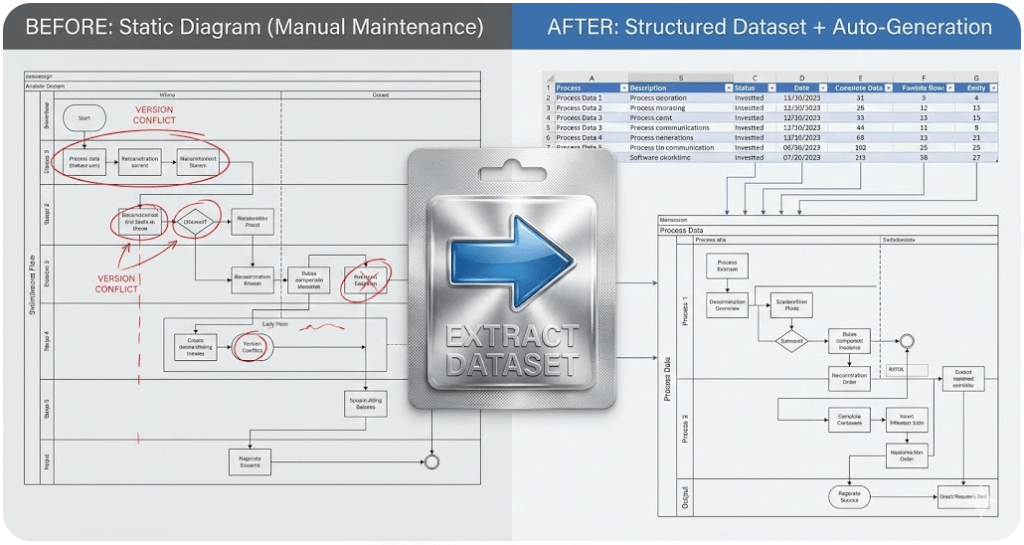
Visio Data Visualizer can generate diagrams from a dataset. The practical challenge is converting real-world process maps into that dataset format and keeping them current as the process changes.
Most visitors arrive looking for 1 of 3 outcomes: fix an import error, convert a diagram to Excel, or get a working template. This hub routes to the best page for each.
Quick start (pick your goal)
Fix a Data Visualizer import error
Start here if Visio rejects the dataset or produces missing ID errors.
Convert a Visio diagram to Excel
Start here if the real goal is auditing, governance, or analysis in Excel.
Get a working Data Visualizer template
Start here if the goal is a known-good TSV and a clean structure you can adapt.
Build or update swimlane diagrams
Start here for cross functional flowcharts, lanes, handoffs, and refreshable diagrams.
Core guides (format, troubleshooting, conversion)
If the dataset does not import cleanly, no downstream page matters. Fix format first, then scale.
Templates and dataset examples
Copy a known-good dataset, import it once, then adapt the rows to your process.
For swimlane templates specifically: cross functional flowchart template and swimlane diagram template.
Swimlane diagrams and cross functional flowcharts
Swimlanes become maintainable when Function and Phase are dataset fields. That turns “redraw work” into “row edits”.
Audit, AI, and multi-view lenses
Once the process is a dataset, analysis becomes straightforward: pivots, counts, and reclassification. That is where the “one model, many views” capability becomes real.
Lite and Standard
| Offer | Best for | Next step |
|---|---|---|
| Lite (Free) | Validate the workflow on the first 20 steps of a real diagram. | Download Lite |
| Standard (Unlimited) | Full-size conversion, repeatable updates, and building a maintainable process library. | Buy Standard |
The fastest way to understand the product is to run 1 file through Lite, then upgrade if the workflow fits.

FAQ
What is Visio Data Visualizer?
It is a Visio feature that can generate a flowchart from a dataset. The dataset controls steps, connections, and (for swimlanes) lanes and phases.
Why does Data Visualizer feel hard to use?
Because the importer is strict. If headers, IDs, references, or formatting are off, Visio rejects the dataset. Templates and known-good examples remove the guesswork.
What does “diagram to dataset” unlock?
Audits in Excel, AI analysis on structured data, and refreshable diagrams that can be regenerated instead of redrawn.
Where should someone start?
Start with the current goal: import troubleshooting if the dataset fails, diagram to Excel if the goal is analysis, or a template if starting from scratch.
Is this affiliated with Microsoft?
No. Microsoft, Visio, and Excel are trademarks of Microsoft. This site describes an independent tool and is not affiliated with Microsoft.


