TSV

infographic titled “Visio Diagram to Excel: 3 Outputs People Expect.” At the top, a simple diagram icon labeled “Diagram” points to a table icon labeled “Dataset.” Below are three side-by-side panels. Panel one, “Data Visualizer Dataset,” shows a table icon and explains that structured data includes shape properties, connectivity, and hierarchy, enabling two-way synchronization. Panel two, “Audit-Ready Table,” shows a clipboard icon and describes a comprehensive, verifiable report with unique identifiers, attributes, and timestamps for traceability. Panel three, “Inventory/Register,” shows a checklist icon and describes a detailed asset list with metadata such as model numbers, locations, and status. At the bottom, a dataset icon points to a regenerated diagram icon, indicating the dataset can recreate the diagram.

Visio Diagram to Excel: What People Mean…

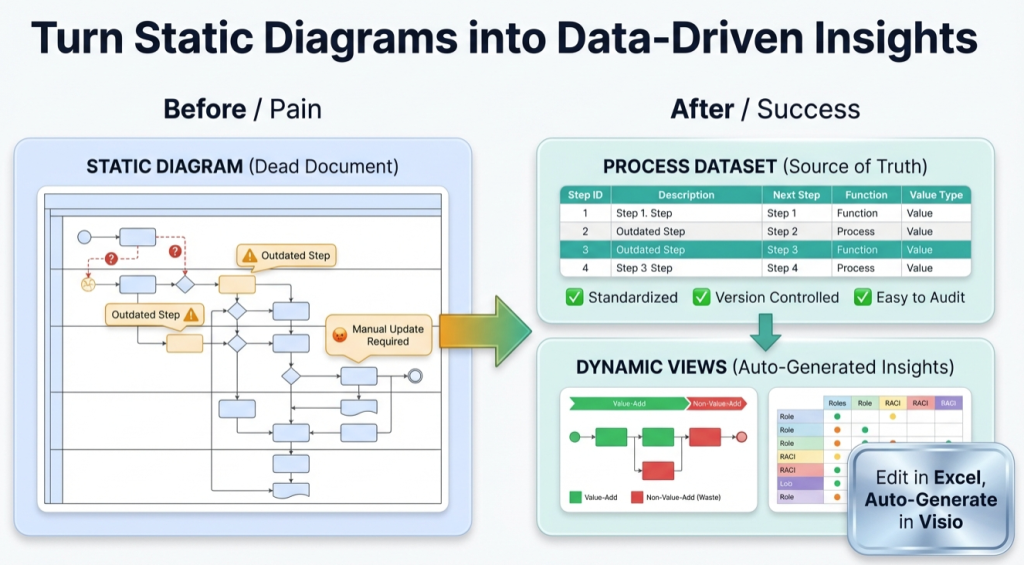
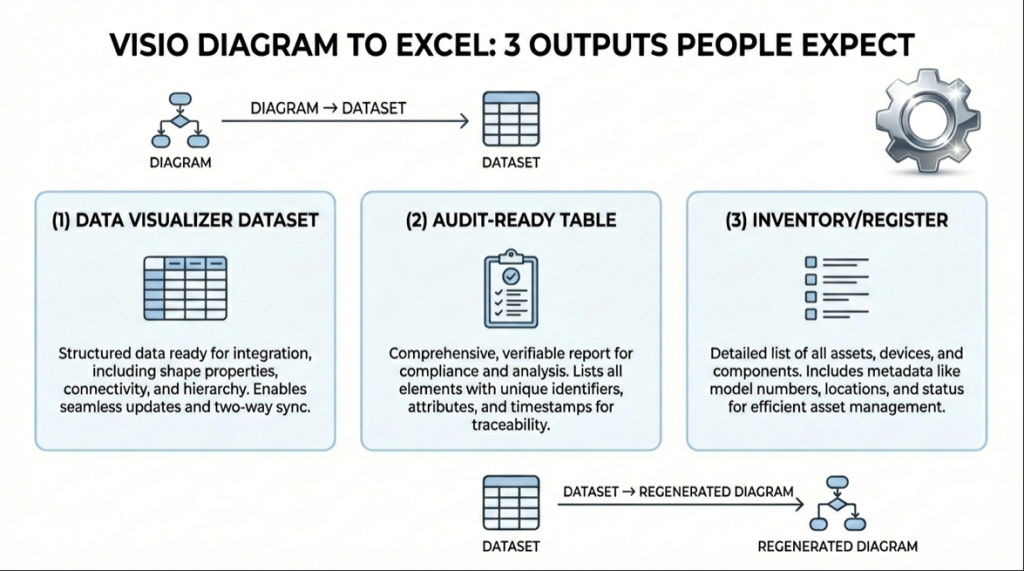
“Convert Visio to Excel” is ambiguous. This guide breaks down the real meanings, shows the right output for each, and explains why a Data Visualizer-ready dataset is often what people actually need.

Visio Diagram to Excel: What People Mean… Read More »

, , , , , , , , ,
infographic titled ‘Turn Static Diagrams into Data-Driven Insights.’ On the left, a ‘Before / Pain’ section shows a cluttered static process diagram labeled ‘Static Diagram (Dead Document)’ with warning icons, outdated steps, question marks, and a note reading ‘Manual Update Required.’ In the center, a large green arrow points right. On the right, an ‘After / Success’ section shows a clean ‘Process Dataset (Source of Truth)’ table with step IDs and descriptions, checkmarks for standardized, version-controlled, and easy-to-audit processes, and a ‘Dynamic Views’ panel displaying value-add versus non-value-add flow and role responsibility charts. A callout reads ‘Edit in Excel, Auto-Generate in Visio.’ The overall message contrasts manual, outdated diagrams with automated, data-driven process insights.

Turn a Process Diagram Into Process Data (Pt. 1 of 3)

Part 1 shows how to convert a process diagram into a structured dataset, import it into Visio Data Visualizer, and prove the round-trip so the model stays maintainable.

Turn a Process Diagram Into Process Data (Pt. 1 of 3) Read More »

, , , , , , ,
Scroll to Top