Process lenses

infographic showing a workflow titled “One Process Model. Many Strategic Views.” On the left, an Excel-like process dataset table feeds into a central “Strategic Lenses” box containing icons for RACI (Responsible, Accountable, Consulted, Informed), Automation, Risk, Systems, and CX (Customer Experience). Blue arrows extend from the center to the right, where five simplified diagrams illustrate different views: RACI responsibilities, automation levels (manual, assisted, automated), risk indicators, connected systems, and customer experience touchpoints. A “Works with Microsoft Visio” badge appears near the top.

One Process Model, Many Views (Pt. 3 of 3)

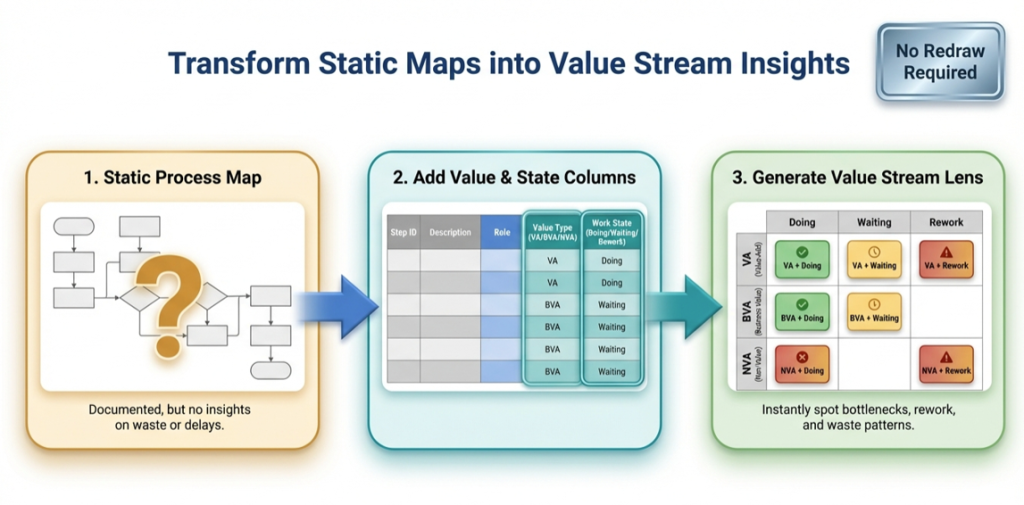
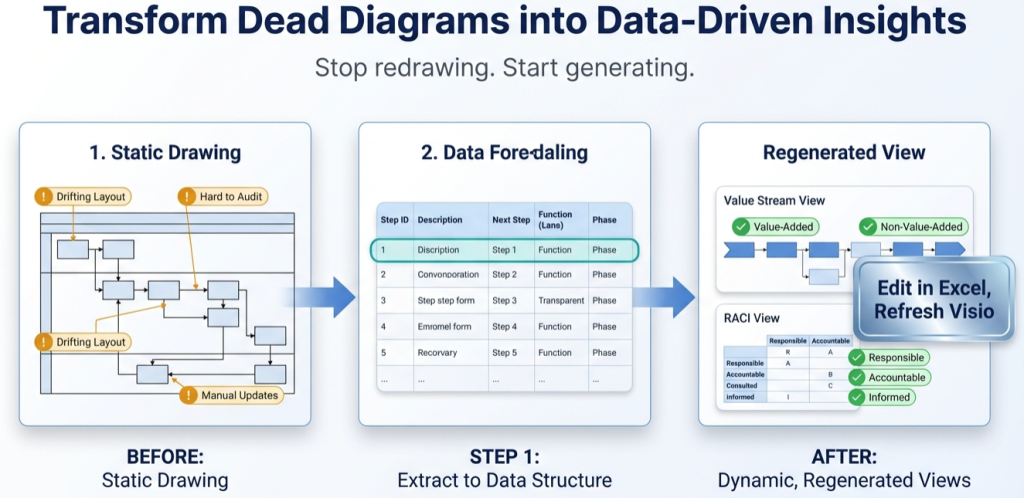
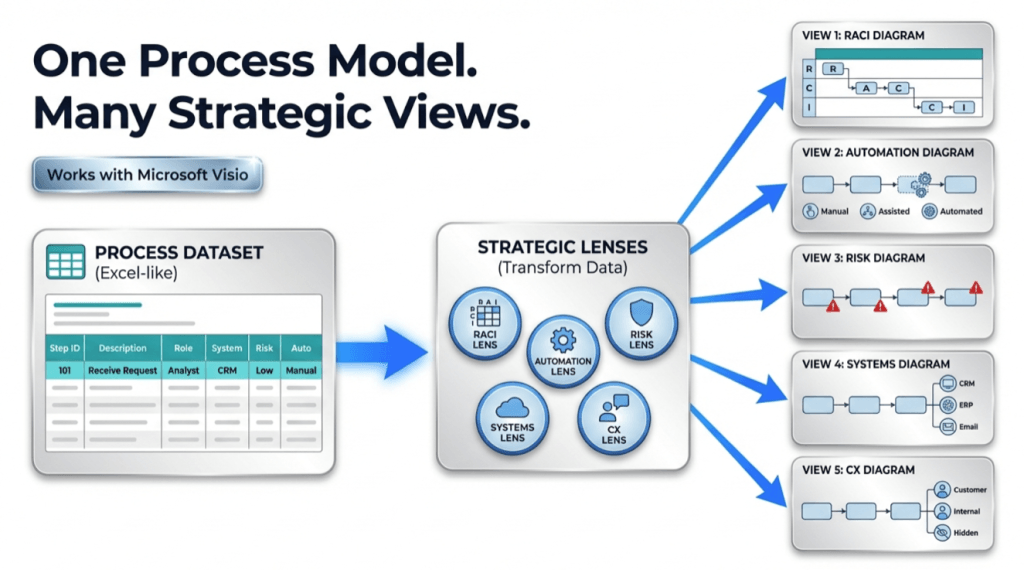
Stop redrawing process maps. Maintain one dataset, render diagrams as views, and generate lens-based variants (value stream, governance, systems, automation) by reclassifying fields in the table.

One Process Model, Many Views (Pt. 3 of 3) Read More »

, , , , , , , , ,
infographic titled ‘Transform Static Maps into Value Stream Insights.’ It shows a three-step flow from left to right: (1) a static process map with a question mark, labeled as documented but lacking insight; (2) a table adding value type (value-added, business value-added, non-value-added) and work state (doing, waiting, rework); and (3) a color-coded value stream lens matrix highlighting bottlenecks, waiting, rework, and waste. A badge in the top right reads ‘No Redraw Required

The Value Stream Lens (Pt. 2 of 3)

A maintainable value stream map starts as a dataset. Learn how to classify steps (VA/BVA/NVA) and time modes (Active/Waiting/Rework), then render the lens in Visio Data Visualizer and quantify it in Excel.

The Value Stream Lens (Pt. 2 of 3) Read More »

, , , , , , , , ,
Scroll to Top