Main hub: Visio Data Visualizer. Swimlane hub: swimlane diagrams.
Swimlanes as data: the Function field (Post 1)
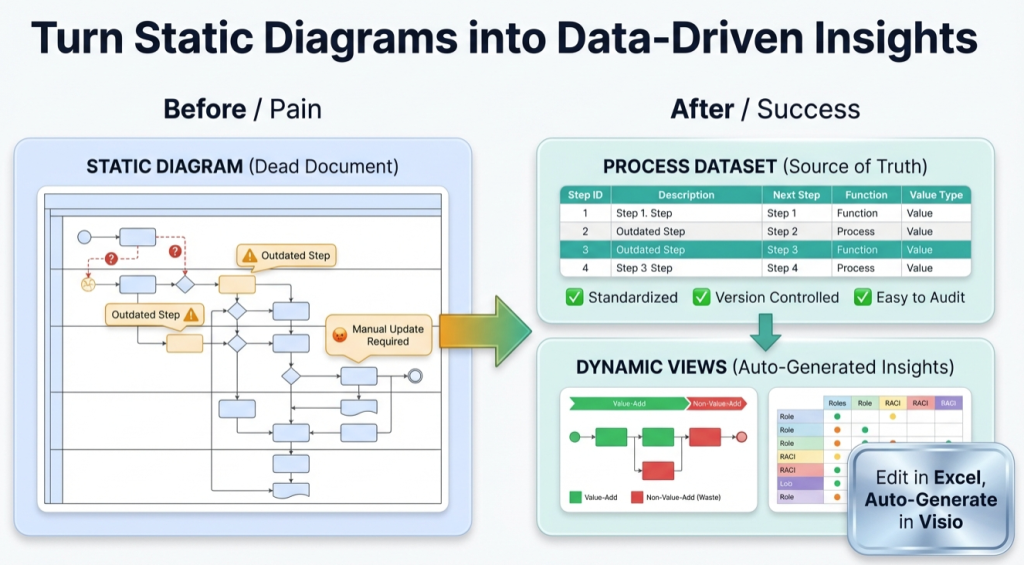
In Visio Data Visualizer, swimlanes are not “drawn”. They are assigned from the dataset. The lane label comes from 1 field: Function.
- Post 1: Function field (this page)
- Post 2: normalize Function data
The 1 field that controls swimlanes
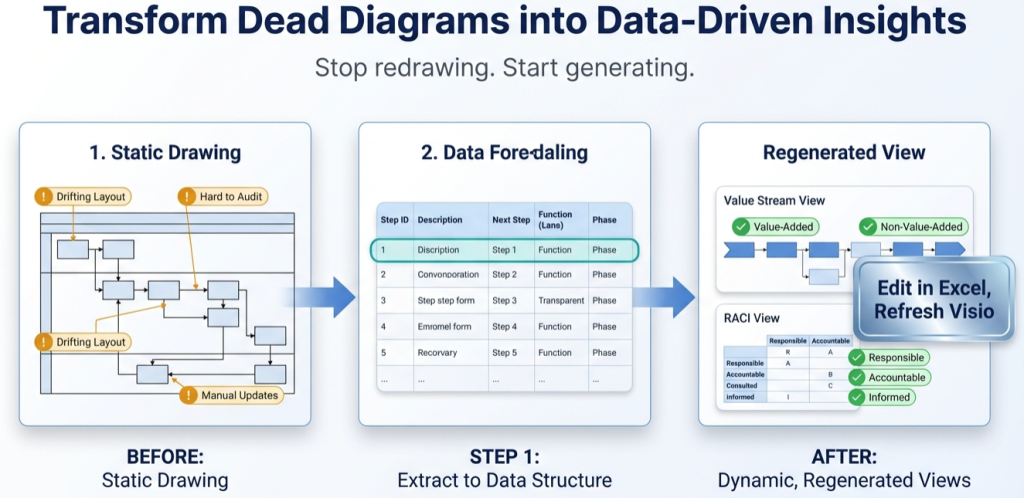
In the Visio Data Visualizer cross-functional flowchart template, the dataset is the source of truth. The swimlane assignment comes from the Function column.
Think of it this way: Function controls the lanes. Phase (if used) controls the columns.
This matters because it changes the maintenance model: lane changes become a data edit, not a redraw project.
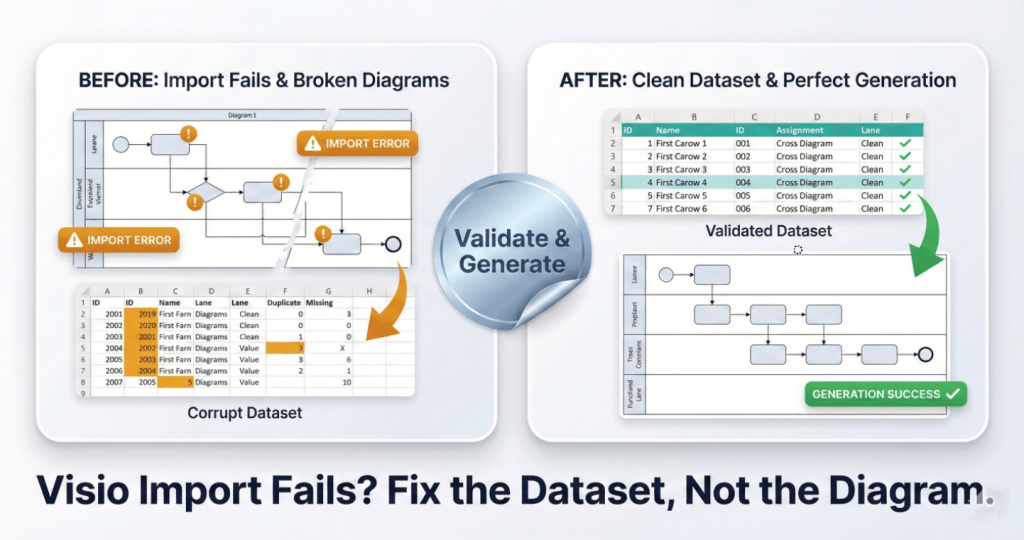
Dataset rules are strict. If imports fail or lanes behave unpredictably, start here: Data Visualizer dataset format and import troubleshooting.
How to map a swimlane diagram to Function
A swimlane diagram already contains the information needed for a dataset. The key is to convert the visual layout into stable IDs, connections, and lane assignments.
| From the diagram | In the dataset | Notes |
|---|---|---|
| Each box | 1 row (Process Step Description) | Keep wording short and consistent |
| Lane label | Function |
Use 1 canonical lane name per lane |
| Arrow to next step | Next Step ID |
Branching uses comma-separated IDs in 1 cell |
| Start / process / decision / end shape | Shape Type |
Keep shape semantics consistent for import |
| Columns or stages (optional) | Phase |
Use only if it adds real decision value |
A fast way to reduce risk is to prove the round-trip with a small slice: build a 20-step dataset, import, then change 1 Function value and re-import.
Template shortcut: swimlane diagram template and Data Visualizer template.
Choosing lane granularity
Lanes should support a decision. If the question is “where do handoffs happen?”, Function should represent a real boundary.
- Department lanes – best for accountability and handoffs
- Role lanes – best for staffing and approvals
- System lanes – best for automation and integration planning
Mixing department and system labels in the same lane scheme usually creates confusion. If multiple viewpoints are needed, keep 1 canonical dataset and create derived views.
Steps with multiple owners
A swimlane view becomes hard to interpret when a single step “belongs” to multiple lanes. Keep Function as a single primary lane owner per step.
- Option A: capture secondary ownership in another column (example:
Secondary Owner) - Option B: split the step into 2 steps if the handoff matters operationally
- Option C: keep the step in the accountable lane and tag consulted parties separately
For governance and accountability viewpoints, see: RACI (Responsible, Accountable, Consulted, Informed) in Visio.
What becomes measurable in Excel
Once Function is reliable data, Excel can quantify what the diagram usually hides.
- Handoffs – count Function changes across connected steps
- Approval load – tag approvals and pivot by Function
- Rework loops – detect “back edges” in Next Step IDs
- Swivel-chair work – use system-lane views to expose manual copying between tools
Swimlanes as data turns the diagram into a measurement surface. That is where process improvement gets real.
Related: audit a Visio process map in Excel.
Common issues and quick fixes
- Phantom lanes – usually caused by trailing spaces or inconsistent capitalization in Function. Fix by normalizing lane values (next post covers the workflow).
- Blank lanes or unassigned steps – Function should not be empty for steps that must appear in lanes.
- Too many lanes – if there are 20+ lanes, create a higher-level view and keep detailed lanes as a separate lens dataset.
- Import errors – strict TSV (tab-separated values) formatting rules apply. No blank rows, correct headers, consistent IDs.
If the diagram needs to be refreshed weekly, see: update swimlane diagrams without redrawing.
Recommended next steps
FAQ
Is Function required for a swimlane diagram in Data Visualizer?
Yes. Function is the field that assigns each step to a lane in the cross-functional flowchart layout. If Function values are missing or inconsistent, lanes will not behave predictably.
What is the difference between Function and Phase?
Function controls swimlanes (who or what owns the step). Phase controls columns (stage, lifecycle, or grouping across the top) if Phase is used in the template.
Can Function be a system instead of a department?
Yes. Function can represent departments, roles, systems, or a classification lens. The key is consistency: pick 1 lane scheme per dataset, and use derived datasets for additional viewpoints.
What causes phantom lanes?
The most common cause is data drift: trailing spaces, inconsistent capitalization, or multiple labels for the same lane. The fix is normalization (see Post 2).
What is the fastest way to prove the workflow works?
Convert 20 steps, import once, then change 1 Function value and re-import. If the lane change behaves exactly as expected, the dataset and template are aligned.
Microsoft, Visio, and Excel are trademarks of Microsoft. This site describes an independent tool and is not affiliated with Microsoft.