
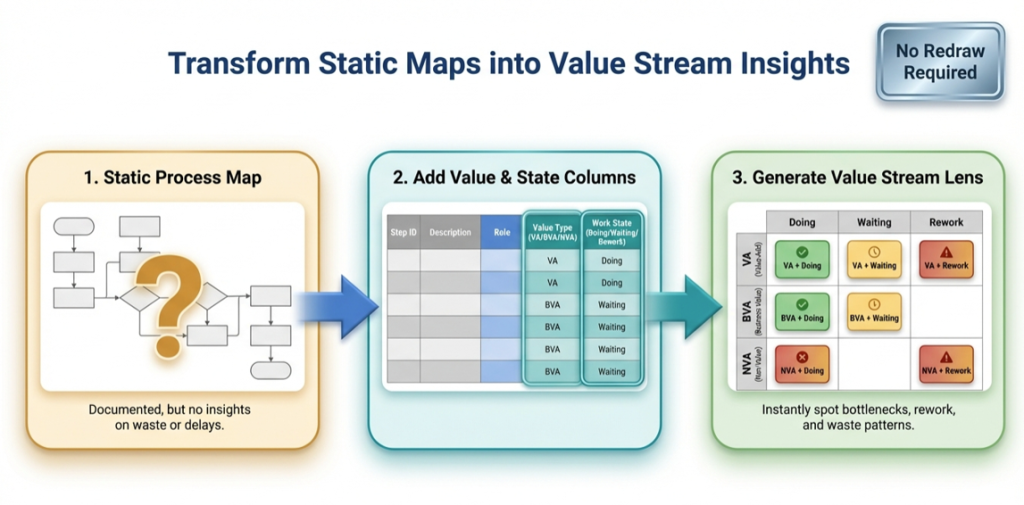
The Value Stream Lens (Pt. 2 of 3)
A maintainable value stream map starts as a dataset. Learn how to classify steps (VA/BVA/NVA) and time modes (Active/Waiting/Rework), then render the lens in Visio Data Visualizer and quantify it in Excel.
The Value Stream Lens (Pt. 2 of 3) Read More »


