swimlane diagrams

Visio to Excel vs Visio to dataset – why “export” is not enough

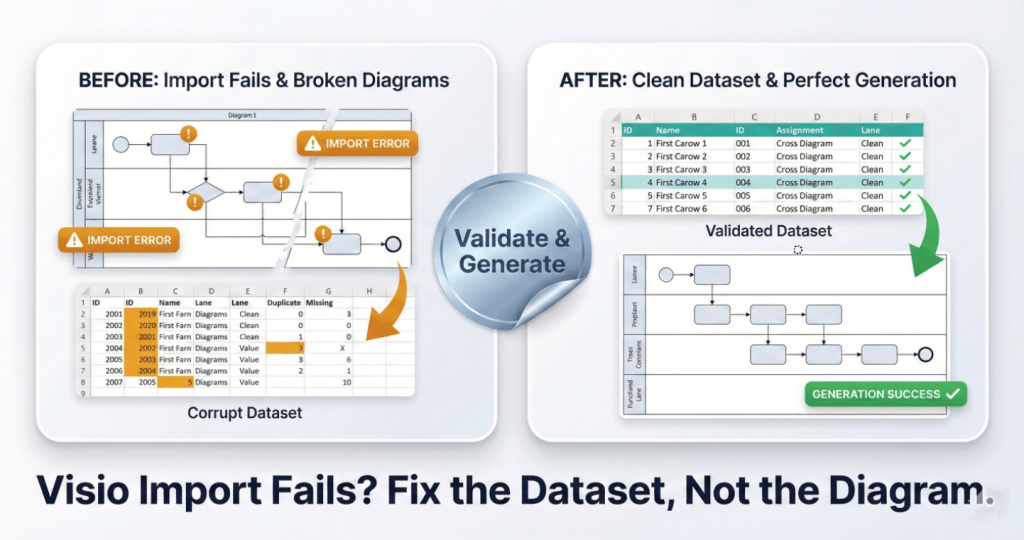
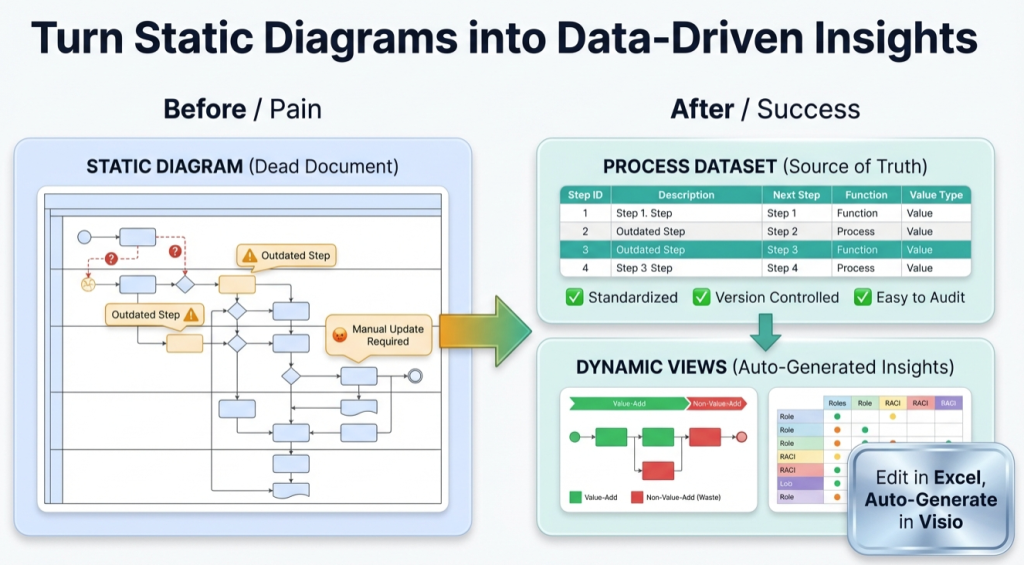
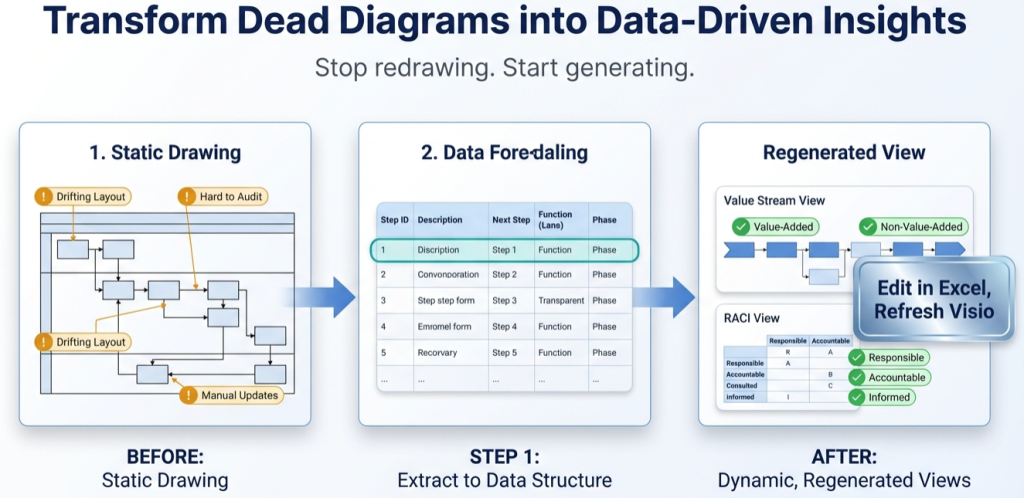
“Visio to Excel” often means “make this process analyzable and maintainable.” This guide explains export vs dataset, when each is appropriate, and the clean dataset-first workflow.

Visio to Excel vs Visio to dataset – why “export” is not enough Read More »

, , , , , , ,

Data Visualizer import errors – top causes and exact fixes

If Visio Data Visualizer rejects a dataset, the cause is usually separators, headers, IDs, branching syntax, or hidden characters. Use this checklist to fix imports quickly and keep refresh cycles stable.

Data Visualizer import errors – top causes and exact fixes Read More »

, , , , , , ,
A square split-screen comparison graphic with a premium metallic trading-card finish. The bottom headline reads "Visio Import Fails? Fix the Dataset, Not the Diagram." The left card, labeled "BEFORE: Import Fails & Broken Diagrams," shows a "Corrupt Dataset" table with amber error highlights and a broken, glitchy flowchart diagram marked with "IMPORT ERROR" warning badges. A central shiny silver foil sticker reading "Validate & Generate" acts as a bridge to the right side. The right card, labeled "AFTER: Clean Dataset & Perfect Generation," displays a clean "Validated Dataset" table with green checkmarks and a perfectly generated, organized flowchart labeled "GENERATION SUCCESS."

Swimlanes as Data: The Function Field (Post 1)

In Visio Data Visualizer, swimlanes are not drawn. They are assigned from the Function field in your dataset. This guide shows how to map lanes correctly, keep names clean, and regenerate swimlane views without diagram surgery.

Swimlanes as Data: The Function Field (Post 1) Read More »

, , , , , , , , ,
infographic titled ‘Turn Static Diagrams into Data-Driven Insights.’ On the left, a ‘Before / Pain’ section shows a cluttered static process diagram labeled ‘Static Diagram (Dead Document)’ with warning icons, outdated steps, question marks, and a note reading ‘Manual Update Required.’ In the center, a large green arrow points right. On the right, an ‘After / Success’ section shows a clean ‘Process Dataset (Source of Truth)’ table with step IDs and descriptions, checkmarks for standardized, version-controlled, and easy-to-audit processes, and a ‘Dynamic Views’ panel displaying value-add versus non-value-add flow and role responsibility charts. A callout reads ‘Edit in Excel, Auto-Generate in Visio.’ The overall message contrasts manual, outdated diagrams with automated, data-driven process insights.

Turn a Process Diagram Into Process Data (Pt. 1 of 3)

Part 1 shows how to convert a process diagram into a structured dataset, import it into Visio Data Visualizer, and prove the round-trip so the model stays maintainable.

Turn a Process Diagram Into Process Data (Pt. 1 of 3) Read More »

, , , , , , ,
Scroll to Top