Main hub: Visio Data Visualizer. Related: Visio diagram to Excel.
Visio diagram to Excel: what people mean…
“Convert Visio to Excel” is an overloaded request. The same phrase hides multiple intents. This guide breaks down the most common meanings and the fastest reliable path for each.
The five meanings behind “Visio to Excel”
Most searches for “Visio diagram to Excel” fall into these categories. The best answer depends on which outcome is actually needed.
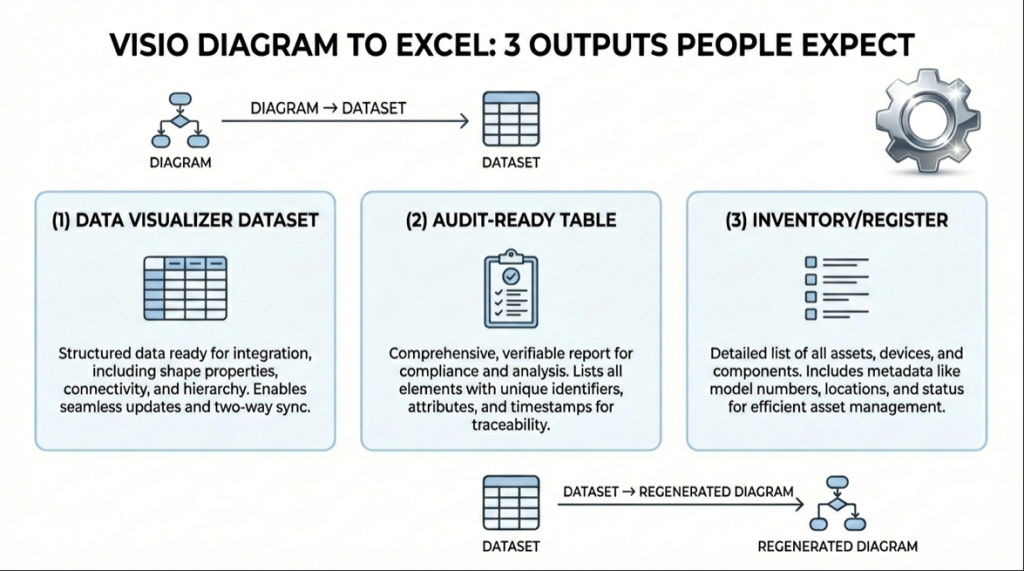
- Extract step text – a simple list of steps from the boxes
- Extract connections – which step leads to which step (the arrows)
- Extract swimlanes – owners, departments, or systems tied to each step
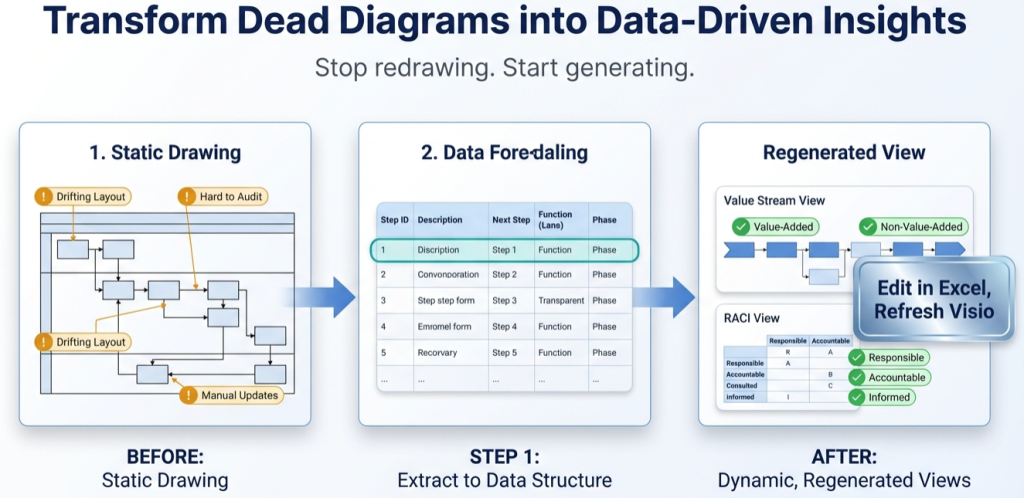
- Create a Data Visualizer dataset – Step IDs plus Next Step IDs that can regenerate the diagram
- Analyze the process – counts for handoffs, approvals, loops, waiting, and rework
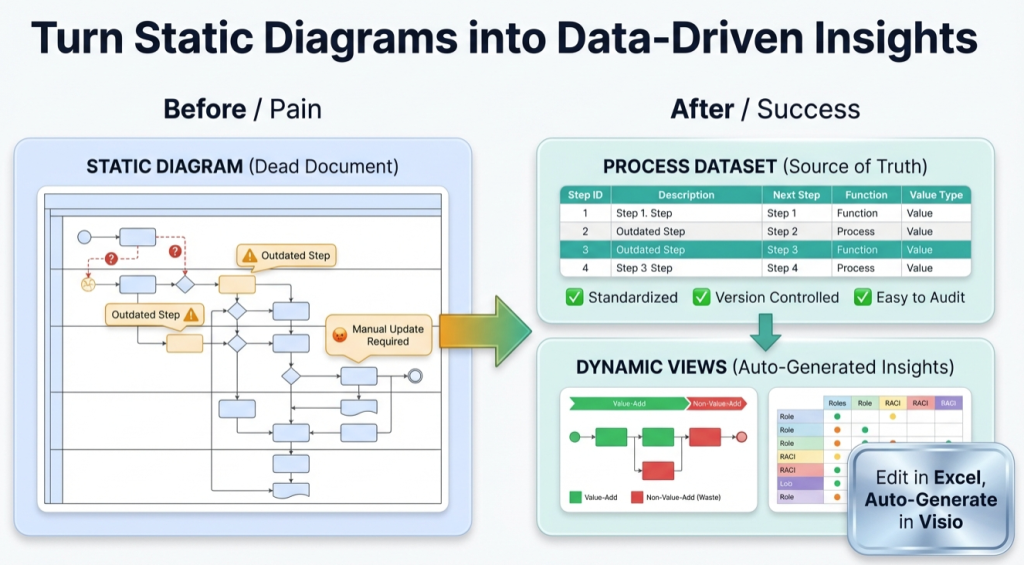
A spreadsheet of shapes is not the same as a process dataset. A dataset behaves like a model: it can regenerate the diagram and power analysis.
If you mean X, do Y
| If the intent is… | The right output is… | Fast path |
|---|---|---|
| Get the step list | A table of step text | Extract text, then refine into stable step wording |
| Understand the flow | Step IDs plus Next Step IDs | Create stable IDs, then map arrows as Next Step IDs |
| Show ownership | Function (lane owner) per step | Normalize lane names and assign each step to 1 owner |
| Keep the diagram current | A TSV (tab-separated values) dataset that imports | Use a known-good template, validate, then import into Data Visualizer |
| Improve the process | A dataset plus analysis fields | Add classifications (approval, waiting, rework) and quantify in Excel |
For swimlane-specific workflows, start with: swimlane diagrams hub.
Why a dataset beats an export
Many “Visio to Excel” exports produce a list of shapes. That is useful for inventory, but it rarely captures the flow in a way that supports regeneration and analysis.
The minimum data model that works
- Process Step ID – unique and stable
- Process Step Description – readable step text
- Next Step ID – the connections (branching is comma-separated IDs)
- Shape Type – Start, Process, Decision, End
- Function – swimlane owner (role, department, system)
- Phase (optional) – stage or lifecycle column
For the strict TSV formatting rules, see: Data Visualizer dataset format.
Bonus: AI (artificial intelligence) tools are far more reliable with structured datasets than with diagram screenshots.
20-step quickstart
The fastest way to avoid overwork is to prove the workflow with a small slice. The goal is a clean round-trip: import from data, change 1 row, refresh the diagram.
- Build 20 steps with stable Step IDs and Next Step IDs.
- Use a known-good template so headers and rules are correct: Data Visualizer template.
- Import into Visio Data Visualizer and fix formatting issues.
- Edit 1 row (change an owner in Function) and re-import.
- Scale up only after the round-trip is reliable.
If the import fails, use: import troubleshooting.
Recommended next steps
For multi-view analysis from the same model, see: one process model, many views.
FAQ
Is “Visio to Excel” the same as “Visio to CSV”?
CSV (comma-separated values) and Excel are formats. The more important question is the structure: step text only, or step IDs plus connections, owners, and shape types.
Why does Visio Data Visualizer prefer TSV?
TSV means tab-separated values. Tabs reduce conflicts with commas in text and help keep imports predictable as long as headers match and there are no blank rows.
Can a dataset regenerate a swimlane diagram?
Yes. When Function holds the lane owner and Step IDs plus Next Step IDs define the flow, Visio Data Visualizer can render a swimlane diagram from data.
What is the fastest way to avoid wasted effort?
Prove the round-trip at 20 steps: import successfully, change 1 row, and re-import. Only then scale up.
Microsoft, Visio, and Excel are trademarks of Microsoft. This site describes an independent tool and is not affiliated with Microsoft.