Main hub: Visio Data Visualizer. Swimlane hub: swimlane diagrams.
Swimlanes as data: normalize Function data (Post 2)
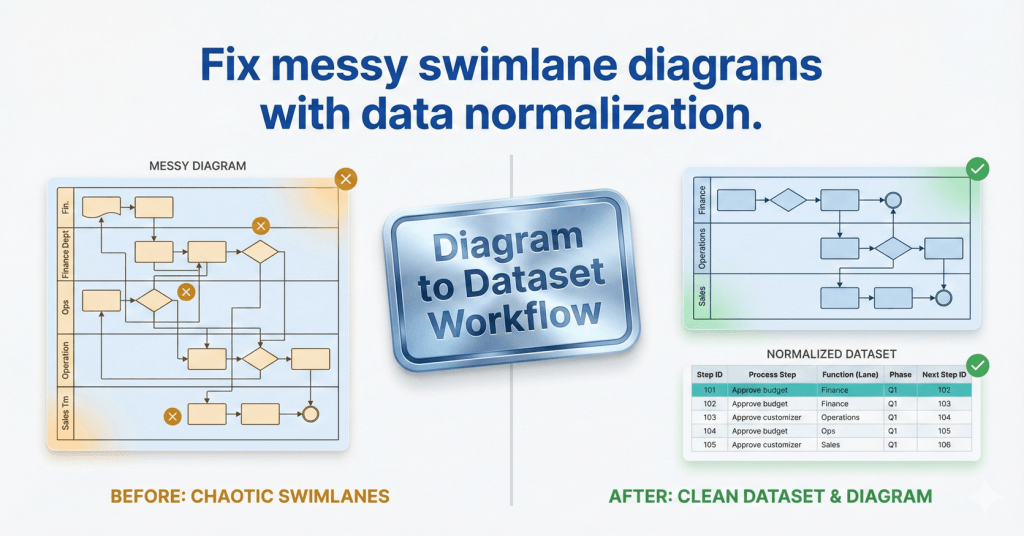
Phantom lanes and messy swimlane diagrams usually have 1 root cause: Function drift. Fix the data once and every future import becomes predictable.
- Post 1: the Function field
- Post 2: normalize Function data (this page)
Why Function drift breaks swimlane diagrams
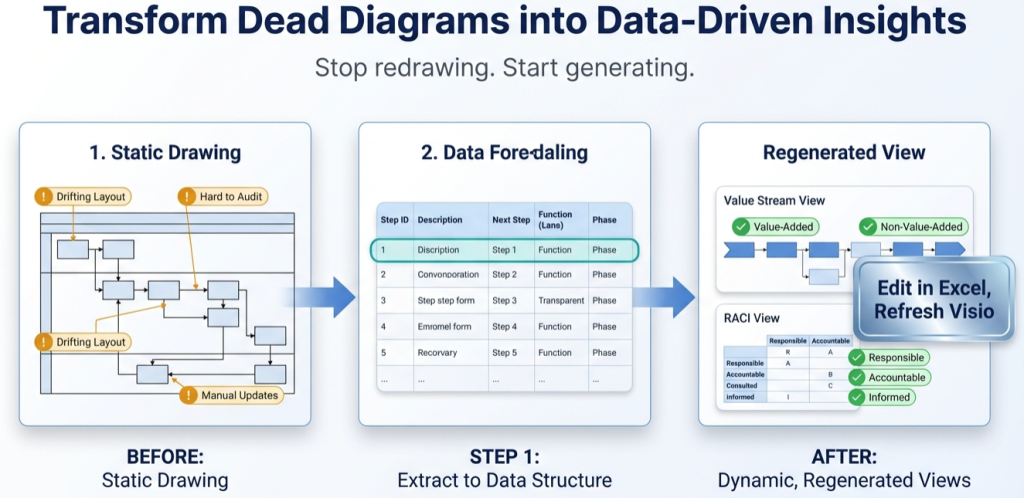
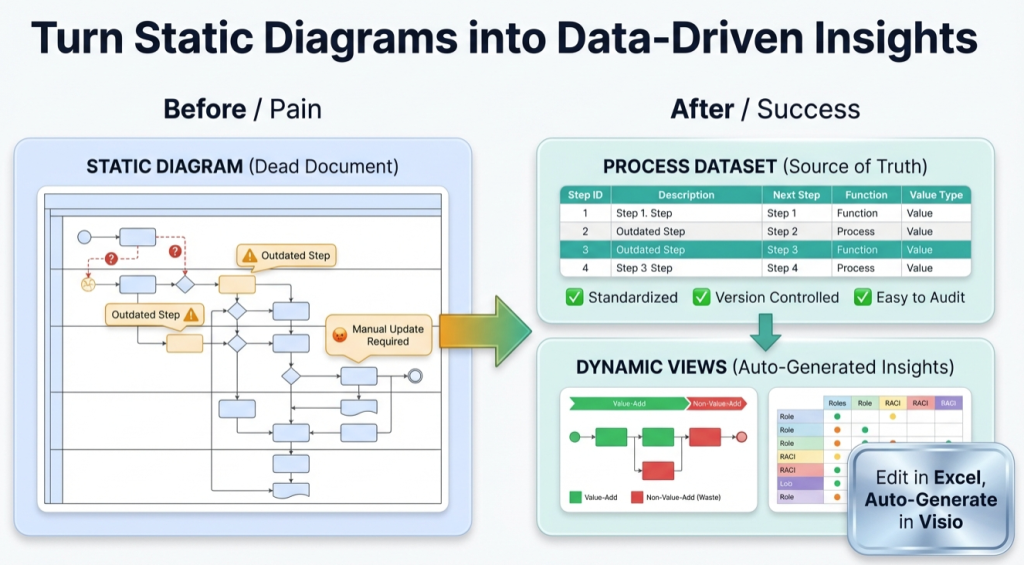
A swimlane diagram is only as clean as the lane labels behind it. In Data Visualizer, lane labels come from Function values. If Function values drift, the diagram drifts.
“Phantom lanes” are usually not a Visio problem. They are a data quality problem: extra spaces, inconsistent naming, or multiple labels for the same lane.
Typical drift patterns:
- Alias drift – Ops vs Operations vs Operations Team
- Whitespace drift – trailing spaces create duplicate lanes that look identical
- Scheme drift – mixing departments, roles, and systems in the same Function field
If the Function field concept is new, start with: Post 1: the Function field.
Normalization workflow (step-by-step)
This is a practical workflow that can be applied to any Visio Data Visualizer dataset. The goal is simple: 1 canonical name per lane.
- Extract unique Function values. Create a list of all lane labels currently used.
- Pick canonical lane names. Decide what each lane should be called going forward.
- Build an alias mapping table. Two columns:
AliasandCanonical. - Apply the mapping. Replace Function values using the mapping so every row uses Canonical.
- Lock it down. Add Excel data validation so Function must be chosen from the canonical list.
- Define lane meaning. Add short definitions so classification stays consistent.
- Repeat for derived datasets. Every lens dataset should inherit the same canonical lane naming rules.
Template + example assets live here: swimlane diagrams hub.
The lane dictionary that prevents rework
Normalization sticks when there is a simple governance artifact. A lane dictionary can be a single sheet in the workbook.
| Column | What it does |
|---|---|
| Lane (canonical) | The approved Function value |
| Aliases | Common alternate labels that should map to canonical |
| Definition | 1 sentence: what this lane means, and what it does not mean |
| Owner | Who approves changes to this lane label |
| Last reviewed | When it was last confirmed to match reality |
If swimlanes need frequent updates, see: update swimlane diagrams without redrawing.
Excel techniques that make it fast
Normalization is easier than it sounds. These are the Excel moves that handle most cases.
- TRIM – removes leading and trailing spaces
- CLEAN – removes non-printing characters
- XLOOKUP – maps Alias to Canonical using the mapping table
- Data Validation – restricts Function values to the canonical list
The goal is not perfect formatting. The goal is predictable lanes and stable measurement.
What improves immediately after normalization
When Function values are clean and consistent, multiple problems disappear at once.
- Imports become predictable – fewer unexpected lane changes and fewer “why did Visio do that?” moments
- Handoff counts become trustworthy – Function changes across connected steps can be measured
- Re-orgs become manageable – update the mapping once instead of redrawing diagrams
- Multiple viewpoints become possible – department view, role view, system view, and lens views can share stable Step IDs
For strict import rules, keep these handy: dataset format and import troubleshooting.
Recommended next steps
FAQ
What is the most common cause of phantom lanes?
Trailing spaces and inconsistent naming in the Function field. Two lanes can look identical to a person while being different strings in data.
Should Function represent departments, roles, or systems?
Any of those can work. The key is not mixing schemes in one dataset. Keep 1 scheme per dataset and use derived datasets for additional viewpoints.
Is normalization only needed once?
A first pass fixes the current dataset. The long-term win comes from prevention: a lane dictionary plus Excel data validation.
Does normalization help conversion and analysis?
Yes. Clean Function values make imports reliable and enable trustworthy handoff and ownership counts in Excel.
What is the fastest way to validate the result?
Import 20 steps, then change 1 Function value and re-import. If the lane updates exactly as expected and no duplicate lanes appear, normalization is working.
Microsoft, Visio, and Excel are trademarks of Microsoft. This site describes an independent tool and is not affiliated with Microsoft.