Related: Visio diagram to Excel | dataset format | AI analysis
Visio to Excel vs Visio to dataset – why “export” is not enough
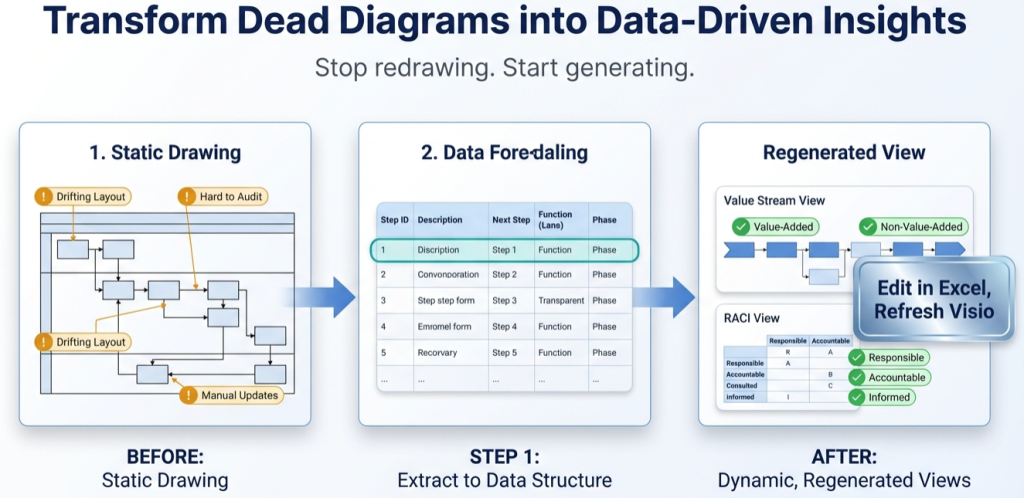
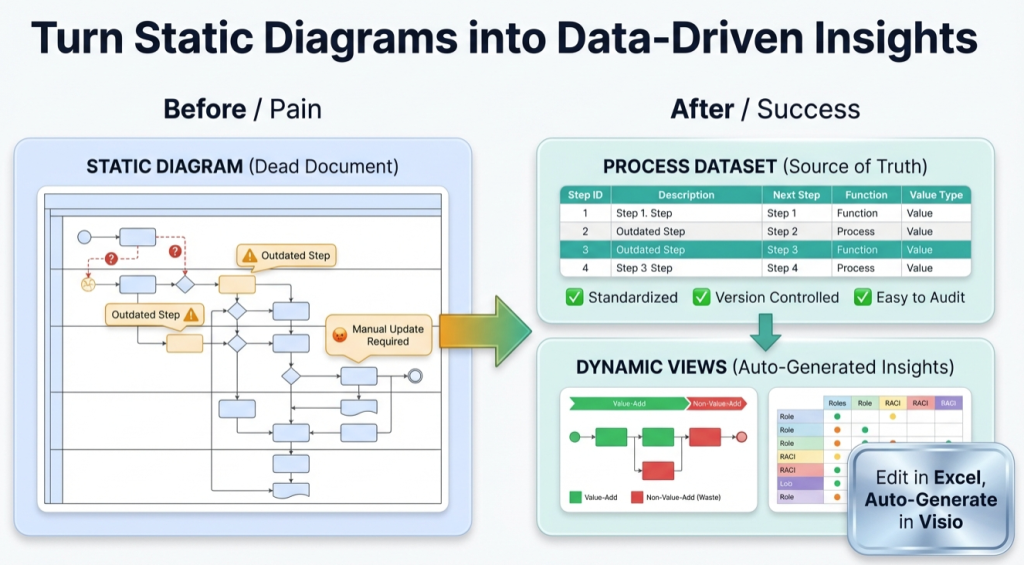
When someone asks for “Visio to Excel”, the real need is often analysis, governance, or maintainability. This guide explains the difference between a one-time export and a reusable dataset that can re-render diagrams.
What people usually mean by “Visio to Excel”
The phrase is ambiguous. It often shows up when someone needs a process map to behave like data, not like a picture. Common meanings include:
- “Get the steps into a table so we can review and edit them.”
- “Count handoffs, approvals, rework loops, or duplicate steps.”
- “Compare 2 versions of a process and see what changed.”
- “Feed the process into AI tools for summarization, audits, or gap detection.”
- “Rebuild the diagram so it stays linked to the data source.”
If the goal is analysis or repeatable updates, the output should be a dataset, not a shape dump. That is the difference between exporting content and modeling logic.
Export vs dataset – the real difference
| Outcome | What you get | What it enables |
|---|---|---|
| Export to Excel | A list of shapes and text (often without reliable connector logic) | Quick documentation, inventories, copy and paste |
| Convert to dataset | A structured table with IDs, Next Step logic, and metadata (Function, Phase, Shape Type) | Re-rendering, refresh cycles, auditing, lens-based views, AI-ready analysis |
Why exports disappoint in practice
Many exports lose the “what happens next” logic. That logic is the actual process. Without Next Step IDs and stable Step IDs, it is hard to answer operational questions.
- Where are approvals concentrated?
- How many cross-team handoffs exist?
- Where does work loop back for rework?
- Which steps touch which system?
5 signals a dataset is the real need
- Someone asks for “the latest version” every month.
- The map changes weekly and redraw work is eating time.
- Leadership asks for multiple views (ops view, systems view, risk view).
- The team wants AI tools to summarize or audit the map.
- There is pressure to quantify the process (handoffs, approvals, rework, delay bands).
Recommended workflow – simple, repeatable, scalable
If the goal is “keep it current and extract insight”, this is the clean path:
- Convert the diagram into a strict dataset (Step IDs, Next Step IDs, Shape Type, Function, optional Phase).
- Validate the dataset using the import error checklist.
- Render the diagram from data using Visio Data Visualizer.
- Update via table edits, then refresh the diagram (no redraw workflow).
- Create lens views by reclassifying Function and Phase in derived tables (optional, but high leverage).
For swimlane and cross-functional work, the dataset-first workflow is covered in the swimlane diagrams hub. For process lenses, start with Visio process mapping.
FAQ
Is exporting to Excel ever the right move?
Yes. If the goal is a one-time inventory of shapes or a quick copy and paste list, export is fine. If the goal is ongoing updates, auditing, or multiple views, a dataset is the better output.
What makes a dataset “AI-ready”?
AI tools work best when the process is structured: a row per step, stable IDs, explicit connections (Next Step ID), and metadata like Function and Phase. That structure makes summarization and pattern detection more reliable.
What is the fastest way to prove the difference internally?
Start with a 20-step pilot dataset. Import it successfully once, then update 1 row and re-import. That round trip demonstrates a maintainable model in minutes.
Where are the strict dataset rules explained?
Start with the dataset format guide, then use the Data Visualizer template to stay compliant.