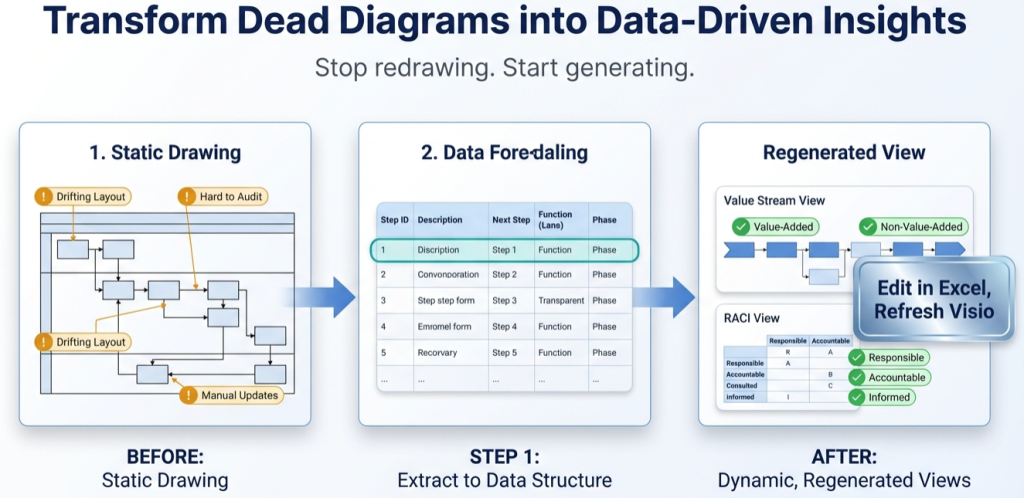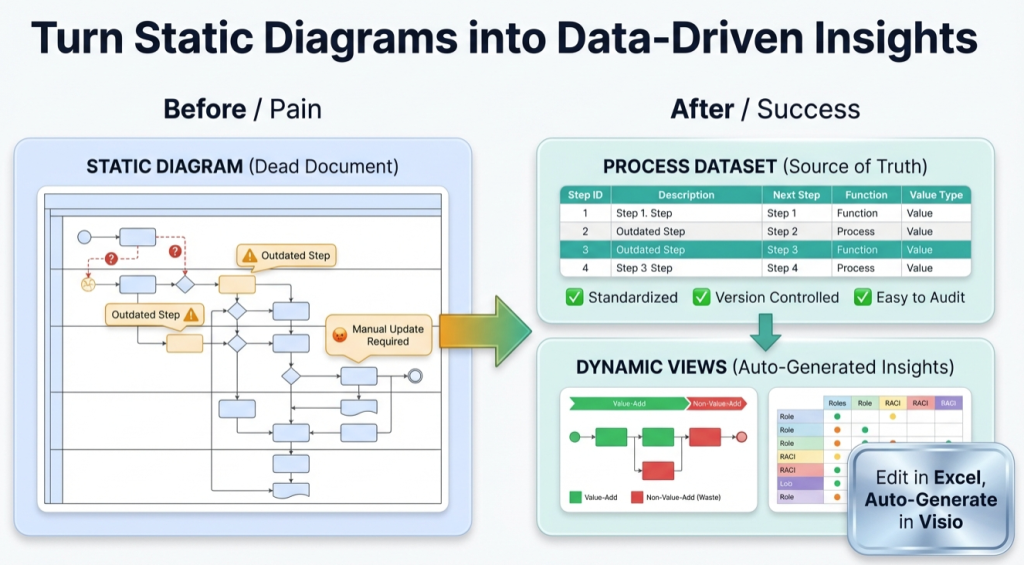
Once your process map is a dataset, you can “re-lens” the same steps to answer different questions. The most useful first lens is almost always value stream — because it turns “a documented flow” into a map of doing vs waiting vs rework, and value-added vs non-value-added.
Pt. 2 goal: Add two columns to your process dataset and regenerate a diagram that makes waste visible.
The value stream lens in one sentence
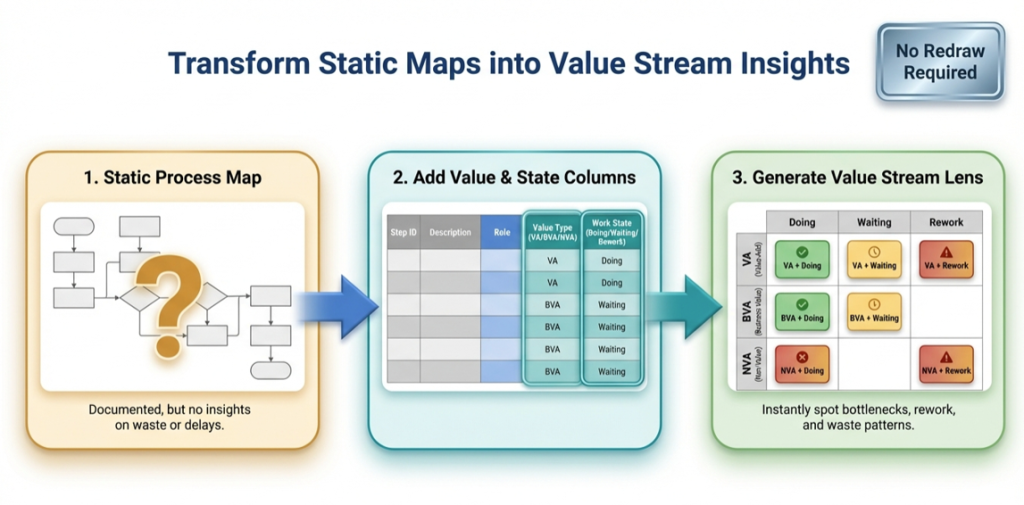
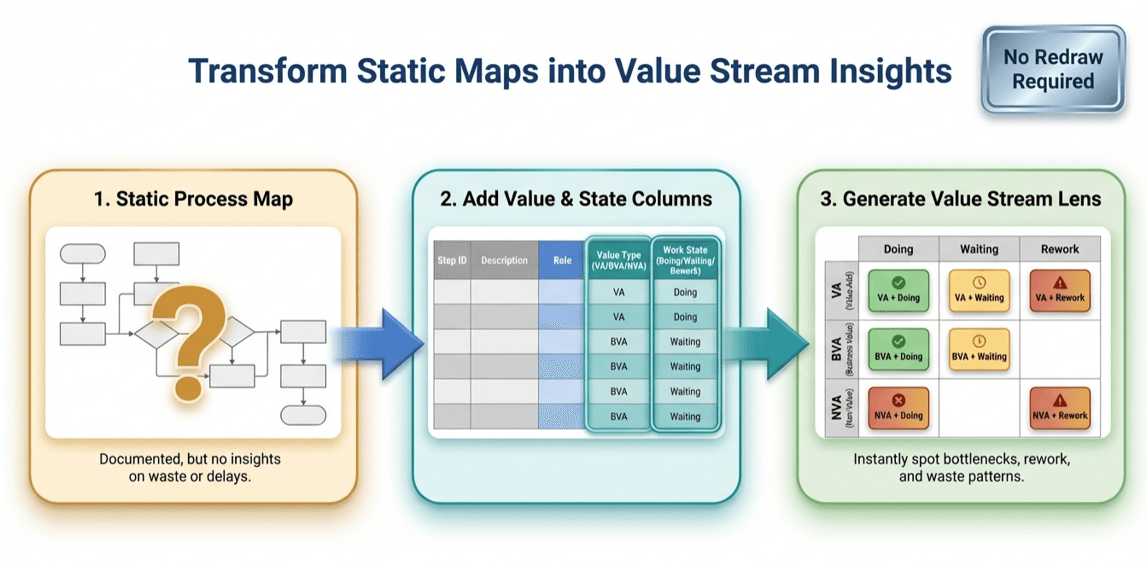
Classify each step by Value Type (VA / BVA / NVA) and Work State (Doing / Waiting / Rework), then regenerate a view that highlights where time and effort are being burned.
Column 1: Value Type (VA / BVA / NVA)
- VA (Value-Added): directly changes the “thing” the customer cares about
- BVA (Business Value-Added): required by the business (compliance, controls, approvals)
- NVA (Non-Value-Added): waste — should be reduced, automated, or eliminated
Column 2: Work State (Doing / Waiting / Rework)
- Doing: productive work is happening
- Waiting: the step exists, but time is mostly queue / delay
- Rework: the step is correcting something that should have been right earlier
A simple scoring table you can use today
You can start with a conservative classification and refine later. The point is to reveal patterns, not to win a philosophical argument.
| Step example | Value Type | Work State | Why it matters |
|---|---|---|---|
| Enter customer order details | VA | Doing | Creates the output the customer requested |
| Wait for approval | BVA | Waiting | Often dominates lead time; highlights bottleneck roles |
| Fix missing data / resubmit | NVA | Rework | Signals upstream defects and unclear requirements |
| Copy/paste between systems | NVA | Doing | Prime automation / integration target |
1 process map, 9 insights
When you classify steps with those two columns, you can answer questions that a normal swimlane diagram hides. Here are nine “insight prompts” your regenerated view should support:
- Where is the lead time mostly waiting? (queue dominates cycle time)
- Where is rework concentrated? (upstream defects and unclear definitions)
- Which BVA approvals can be simplified? (controls that create delay without reducing risk)
- Which NVA steps are actually integration failures? (duplicate entry, manual reconciliation)
- Which swimlane is overloaded with waiting? (a single role becomes the throttle)
- Where do handoffs correlate with NVA? (handoff friction)
- Which phase is mostly waste? (entire stage is mis-designed)
- Where does rework loop back? (structural causes)
- What’s the smallest change that eliminates the most NVA? (high-leverage improvement)
Why this works: You’re no longer looking at shapes. You’re looking at a dataset with classifications. That turns “process mapping” into “process analysis.”
If you haven’t converted the diagram into a dataset yet, start with Pt. 1: Turn a process diagram into process data.
How to regenerate the value stream view (without redrawing)
- Export / open the dataset (Lite is enough to test on a real diagram segment).
- Add the two columns (Value Type, Work State) and classify each step.
- Map lanes/phases to your value stream view (ex: phase becomes “Doing/Waiting/Rework”).
- Regenerate in Visio (Data Visualizer diagram becomes the view).
If you want an end-to-end example of the lens workflow, this page ties it together: RACI + value stream + risk + automation lenses.
Next in the series
Value stream is usually the first lens. Next, you’ll want multiple stakeholder views from one model. Continue to Pt. 3: One process model, many views (RACI, risk, automation).
FAQ
Do I need to be a Lean expert to do this?
No. Start conservative. The classification is just a lens to reveal patterns. You can refine over time as the team aligns on definitions.
What’s the biggest mistake with the value stream lens?
Trying to make the classification “perfect” before you learn anything. Use it to find your top sources of waiting and rework first.
How does this connect to selling the software?
The lens is the “reason to buy.” The generator makes it fast to get the dataset from a real diagram so you can actually run the analysis.