
For swimlanes: Swimlane diagrams.
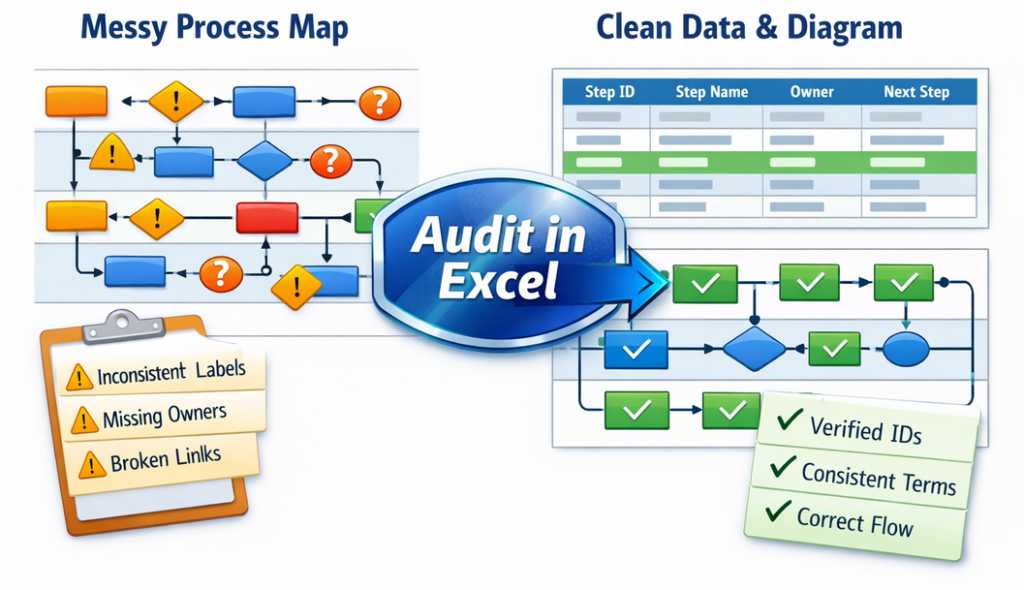
Audit a Visio process map in Excel
If a process map cannot be audited, it cannot be managed. The easiest way to audit is to convert the diagram into a dataset, then use Excel to count handoffs, approvals, loops, and other sources of friction.
The fastest path from diagram to dataset: dataset generator overview.
Why auditing a diagram is hard
A drawing is not a model. It is a picture of a model that is trapped in shapes.
- Shapes are hard to count reliably.
- Connectors are not queryable.
- Ownership changes require layout changes.
- Every “new view” requires redraw work.
Once the process is a dataset, auditing becomes spreadsheet-native. That is the difference between “pretty picture” and “decision tool”.
Step-by-step audit workflow
- Convert the diagram into a dataset. Start from an existing .vsdx file or a template.
- Validate the dataset. IDs are unique, references exist, and the file has no blank rows.
- Open in Excel and add audit columns. The audit columns make patterns visible.
- Run pivots and counts. Quantify the friction instead of debating it.
- Regenerate the diagram from data. Keep the dataset as the source of truth.
Recommended Excel columns (audit pack)
Keep the base dataset columns intact, then add a small set of audit columns.
| Column | Type | What it unlocks |
|---|---|---|
| Process Step ID | Base | Stable reference for versioning and lookups. |
| Process Step Description | Base | Readable steps that can be classified. |
| Next Step ID | Base | Graph logic (connectors, branching, loops). |
| Shape Type | Base | Decisions vs processes vs start/end. |
| Function | Base | Swimlanes, ownership, handoffs. |
| Phase | Base | Stages, sequencing, batching signals. |
| Approval Tier | Audit | Quantify governance friction (team lead, manager, director, committee). |
| System / Tool | Audit | Find swivel-chair work and integration targets. |
| Value Category | Audit | Value stream lens (VA, BVA, NVA). |
| Time Mode | Audit | Active vs Waiting vs Rework. |
| Automation Potential | Audit | High vs medium vs low candidates. |
For multi-view analysis from the same dataset: process lenses.
High-value audits to run first
Start with audits that produce obvious action and are hard to argue with.
| Audit | How to measure in Excel | Why it matters | What to do next |
|---|---|---|---|
| Lane sprawl | Count distinct Function values. | Too many lane labels hides handoffs and breaks governance. | Standardize lane names as controlled labels. |
| Approvals | Count decision steps and Approval Tier frequency. | Approvals often create waiting time without improving outcomes. | Collapse redundant approvals, clarify decision rights. |
| Rework loops | Flag steps that point back to earlier steps (loop indicator). | Rework is the most expensive waste because it repeats work. | Fix upstream criteria, templates, or intake quality. |
| Handoffs | Create an edge list and count transitions where Function changes. | Handoffs drive delay, defects, and coordination cost. | Reduce ping-pong, align ownership, simplify routing. |
| Waiting clusters | Use Time Mode tags and pivot by Phase and Function. | Waiting is usually a capacity or governance constraint. | Remove gates, reduce batch size, add clear service levels. |
Need a known-good dataset to start from? Use: basic flowchart example or cross functional example.
Example Excel formulas
The dataset becomes far more useful when it can compare a step to its next step. The example below uses XLOOKUP (Excel 365). Older Excel can use INDEX/MATCH.
NextFunction
=LET(next,[@[Next Step ID]],
     XLOOKUP(next,Table1[Process Step ID],Table1[Function],"" ))
IsHandoff
=IF([@NextFunction]="","",IF([@NextFunction]<>[@Function],1,0))
IsDecision
=IF(LOWER([@[Shape Type]])="decision",1,0)
For decisions with multiple Next Step IDs (branching), build a small “edge table” that splits branches into separate rows. That keeps handoff and loop counts accurate.
What to do with the findings
Audits should end in a prioritized action list, not another diagram.
- Pick 1 friction theme (approvals, handoffs, rework, waiting) and fix it end-to-end.
- Update the dataset as changes are made – do not “fix the diagram by hand”.
- Regenerate the diagram after changes so leadership sees a current view.
- Re-run the pivots after each change cycle to measure lift.
Conversion path: validate with Lite, then scale with Standard.
FAQ
What does “audit a process map” mean in practical terms?
It means turning the process into a dataset and quantifying friction: handoffs, approvals, rework loops, waiting, and tool handoffs.
Does this require creating a new diagram from scratch?
No. The process can be converted from an existing Visio diagram into a dataset, then imported into Data Visualizer to regenerate a linked diagram.
What is the single best audit to run first?
Approvals and handoffs. They usually drive waiting time, and they are typically fixable without changing core work content.
How is this different from “export Visio to Excel”?
Exporting shapes is not the goal. The goal is a dataset with stable IDs and Next Step logic that can regenerate a diagram and support analysis.
What is the fastest way to validate the workflow?
Use Lite on a real file to validate the first 20 steps, then upgrade to Standard for full-size conversion and ongoing maintenance.
Microsoft, Visio, and Excel are trademarks of Microsoft. This site describes an independent tool and is not affiliated with Microsoft.


