
Part of the Swimlane diagrams hub and the Visio Data Visualizer guide.
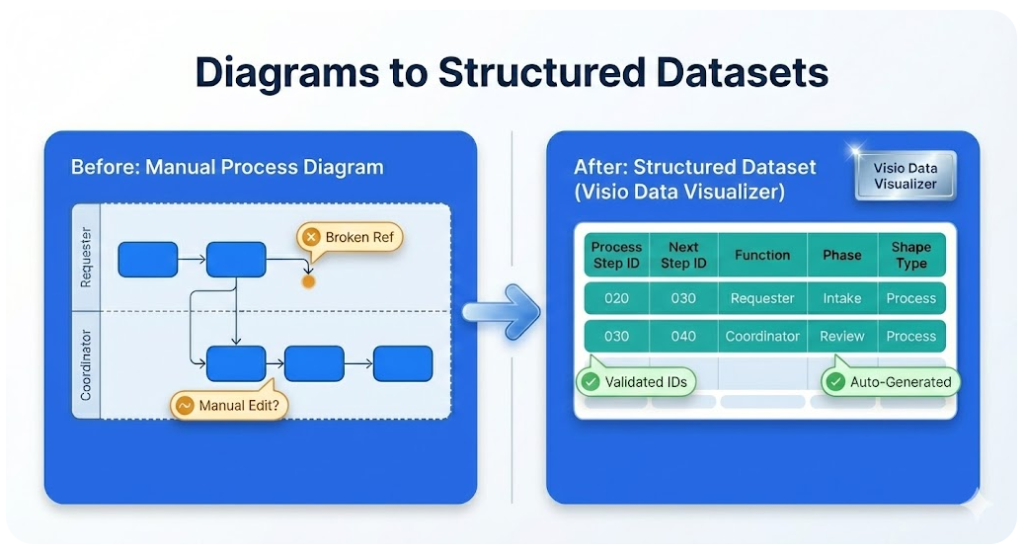
Cross functional flowchart dataset example (Visio Data Visualizer)
This is a known-good TSV (tab-separated values) dataset example for a cross functional flowchart (swimlane diagram) in Visio Data Visualizer. Copy it, import it successfully, then adapt the rows to match a real process.
If a Visio file already exists and the goal is “diagram to dataset” without rebuilding by hand, start here: dataset generator overview.
TSV dataset example (copy and import)
Copy the TSV below into a file named cross-functional-example.tsv. Use real tab characters between columns. Do not add blank lines.
Process Step ID        Process Step Description        Next Step ID        Connector Label        Shape Type        Phase        Function
010        Start – Receive request        020                Start        Intake        Requester
020        Log request in tracker        030                Process        Intake        Coordinator
030        Is request complete?        040,050                Decision        Review        Coordinator
040        Request missing info        020                Process        Review        Coordinator
050        Approve request?        060,070                Decision        Approve        Manager
060        Reject request        080                Process        Approve        Manager
070        Execute work        090                Process        Execute        Ops Team
080        Notify requester of rejection        100                Process        Close        Coordinator
090        Quality check        100                Process        Close        Quality
100        Close request        110                Process        Close        Coordinator
110        End – Request closed                        End        Close        Requester
Strict format rules and troubleshooting: dataset format and import troubleshooting.
How to import into Visio Data Visualizer
- Open Visio and create a new Cross-Functional Flowchart (Data Visualizer).
- Choose the option to create the diagram from a data file.
- Select the TSV file created from the example above.
- Confirm the diagram renders with swimlanes (Function) and phases (Phase).
- If Visio shows an error, use the format checklist and fix the dataset, then re-import.
Most failures are dataset issues (IDs, references, blank lines). Start with: import troubleshooting.
How to adapt this dataset to a real process
Use this as a conversion checklist:
- Keep Step IDs stable. IDs are the backbone. Do not reuse an ID for a different step.
- Standardize swimlane names. Treat Function values as controlled labels (no synonyms).
- Branching uses 1 cell. Multiple next steps are comma-separated IDs with no spaces.
- Phase should be a small set. Use stages that match time progression (Intake, Review, Execute, Close).
- Make step text measurable. Prefer verb + object + condition.
When the goal is converting an existing diagram (not drafting from scratch), this page is the bridge: Visio diagram to Excel.
More swimlane resources in this silo
These pages are designed to work together.
Consistent CTA path: validate with Lite, then scale with Standard.
FAQ
What is a cross functional flowchart dataset?
It is a structured table (TSV) where each row is a process step, and the Next Step ID column defines the connections. Function creates swimlanes, and Phase creates the stage columns.
How is branching represented in the dataset?
For a decision step with multiple outcomes, list multiple Next Step IDs in the same cell as comma-separated values with no spaces. Example: 040,050.
Why does Visio Data Visualizer reject datasets?
The most common causes are duplicate Step IDs, missing referenced Next Step IDs, blank TSV rows, or invalid Shape Type values. Use the troubleshooting guide.
What is the fastest way to convert an existing .vsdx diagram into this dataset format?
Use Lite to validate the workflow on the first 20 steps, then upgrade to Standard for full-size diagrams: Download Lite and Standard.
Microsoft, Visio, and Excel are trademarks of Microsoft. This site describes an independent tool and is not affiliated with Microsoft.


