
AI Visio diagram analysis (convert to dataset first)
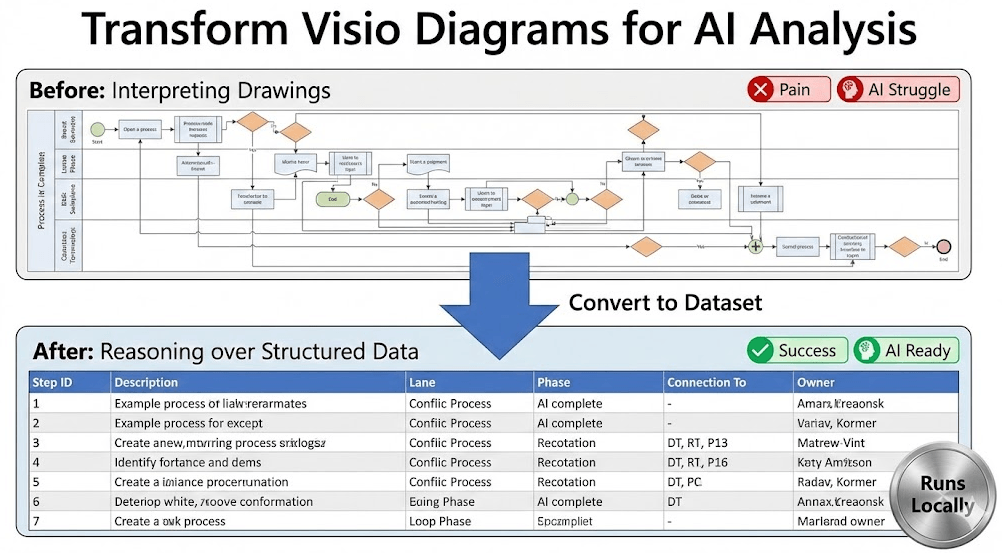
If the goal is to use artificial intelligence (AI) to improve a Visio process map, start by converting the diagram into a Visio Data Visualizer dataset. AI is dramatically better at reasoning over structured rows and connections than pixels in a screenshot.
Best fit: Visio cross-functional flowcharts (swimlanes + phases). The generator runs locally on Windows. You decide what data ever leaves your machine.
Why dataset-first beats diagram-first
A Visio diagram is a drawing. A dataset is a model. When the process is captured as a table (step IDs, descriptions, and connections), AI can:
- follow branches and loops without guessing where a connector goes
- detect missing IDs, duplicate IDs, and orphan steps
- standardize language across steps (so the process reads like a process, not a scrapbook)
- support analysis lenses (value stream, RACI, risk, automation, systems) using added columns
New here? Start with the core workflow: Visio diagram to Excel.
A safe, repeatable workflow
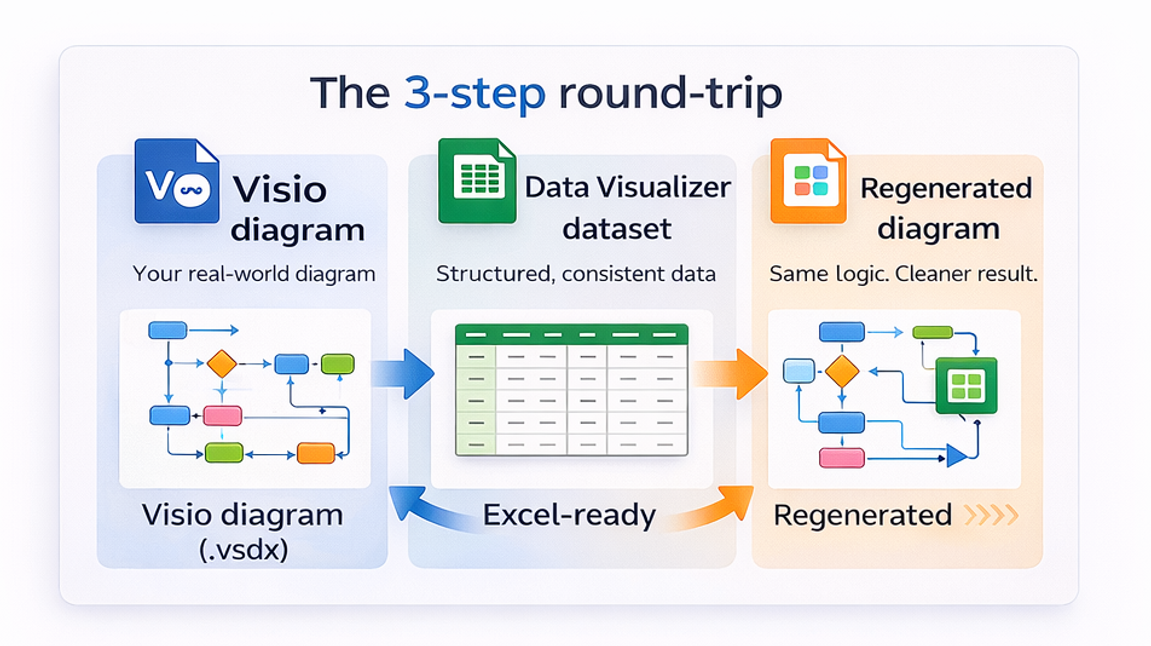
- Convert diagram –> dataset using the generator (Lite or Standard).
- Sanitize the dataset (remove names, emails, ticket IDs, customer data, or anything sensitive).
- Run AI analysis using the prompt library below (or your own prompts).
- Apply improvements in Excel (change rows, not shapes).
- Regenerate the diagram using Visio Data Visualizer (dataset –> diagram).
If Visio rejects the import, the issue is almost always dataset integrity. Use: Data Visualizer import troubleshooting.
What to export for AI
The minimum useful dataset for AI analysis is the same minimum needed for a stable Data Visualizer diagram.
| Field | Why it matters |
|---|---|
| Process Step ID | Prevents ambiguity and enables reliable references (branches, loops, missing steps). |
| Process Step Description | The work itself. This is what AI reads to propose cleanup, simplification, and automation candidates. |
| Next Step ID | Makes the process graph explicit so AI can follow paths and detect dead ends. |
| Function | Swimlane (who does the work). Enables handoff analysis and ownership lenses. |
| Phase (optional) | Time or stage grouping. Enables delay and rework views when paired with added columns. |
Need the strict rules (headers, allowed shape types, no blank lines)? Use: Data Visualizer dataset format.
Prompt library (copy/paste)
Paste the dataset (or a redacted subset) and ask for the output format you want. For sensitive processes, remove names, emails, and system identifiers first.
1) Structural integrity audit (IDs, branches, loops)
Given this process dataset (Process Step ID, Process Step Description, Next Step ID, Shape Type, Function, Phase):
1) Identify duplicate IDs, missing referenced IDs, and steps with no inbound or outbound connections.
2) Identify loops and summarize what triggers them.
3) Identify decision points and list their branches.
Return results as a checklist with "Issue", "Impact", and "Suggested fix".
2) Bottlenecks and delay hypotheses (handoffs, approvals, rework)
Analyze this process flow and propose:
- likely bottlenecks (handoffs, approvals, loops, rework)
- likely waiting points
- which 5 measurements would validate or falsify the hypothesis (cycle time, queue time, rework rate, etc.)
Return a prioritized list and explain why.
3) Step description cleanup (standardize wording)
Rewrite the step descriptions into a consistent "verb + object + condition" format.
Flag vague steps (example: "Handle request") and propose clearer wording.
Return a table with original text, revised text, and rationale.
4) Automation opportunity scan (what to automate first)
Based on the step descriptions and connections:
1) Identify steps that look repetitive, rules-based, or pure handoff/coordination.
2) Identify approvals that could be replaced with guardrails or sampling.
3) Identify duplicate data entry and "swivel chair" movement between systems.
Return a ranked list with "Opportunity", "Risk", and "First experiment".
5) Risk and control lens (preventive, detective, corrective)
Propose a risk and control view of this process:
- list the top 10 plausible risks (quality, financial, compliance, cybersecurity)
- for each risk, propose preventive controls, detective controls, and corrective controls
Return a table mapping risks to the relevant step IDs.
6) RACI lens (Responsible, Accountable, Consulted, Informed)
Create a RACI assignment proposal for this process:
- For each step, propose Responsible and Accountable roles
- Identify steps with missing Accountable ownership
- Identify steps with too many Consulted roles (likely decision drag)
Return a table by step ID, then summarize patterns.
Want the multi-view method? Use: RACI, value stream, and process lenses.
Turn insights into a better diagram
The win is not the AI output. The win is that improvements become dataset edits that can be reviewed, versioned, and re-rendered cleanly.
- Apply the changes in Excel (IDs, wording, lanes, phases, connections).
- Re-import into Visio Data Visualizer to regenerate a linked diagram.
- Repeat until the process reads clean, stable, and decision-ready.
FAQ
Why not analyze the Visio diagram directly?
AI is stronger on structured datasets than drawings. The dataset makes IDs, branches, loops, lanes, and phases explicit. That reduces guessing and improves the quality of recommendations.
Does the generator upload files anywhere?
No. The generator runs locally on Windows. Your diagram and dataset stay on your machine unless you choose to share them.
What if the dataset import fails in Visio?
Treat it like a data validation problem. The most common causes are duplicate IDs, missing referenced IDs, invalid shape types, or missing lane/phase values. Use: import troubleshooting.
Where is the fastest place to start?
Start with Lite (Free, 20 steps) on a real diagram. If the workflow fits and you need unlimited steps, upgrade to Standard.
Microsoft, Visio, and Excel are trademarks of Microsoft. This site describes an independent tool and is not affiliated with Microsoft.


