
Visio Data Visualizer › Swimlane diagrams
Swimlane Diagrams
Swimlane diagrams (often called cross functional flowcharts) make ownership, handoffs, and approvals visible in 1 glance.
The problem: most swimlane diagrams go stale because they are maintained as drawings. The fix: maintain the process as a dataset and re-render the diagram when the process changes.
Common use cases: process ownership, audit walkthroughs, approval reduction, automation readiness, and eliminating handoff delays.
What a swimlane diagram is
A swimlane diagram is a flowchart where each step is assigned to a lane (a role, team, department, or system). The lanes make ownership visible.
In practice, many people use these terms interchangeably:
- Swimlane diagram
- Cross functional flowchart
- Deployment flowchart (common in Six Sigma contexts)
The business value is not the picture. The value is that a swimlane diagram makes handoffs, approvals, and delay visible so the process can be improved.
When to use swimlanes
Swimlanes are the right tool when the process crosses roles, teams, or systems and ownership is unclear. Typical reasons to build one:
- Handoffs: work moves across departments and gets delayed.
- Approvals: reviews stack up and nobody can explain why.
- Rework loops: requests bounce back for fixes.
- System touchpoints: people copy data between tools.
- Auditability: evidence, controls, and responsibilities must be clear.
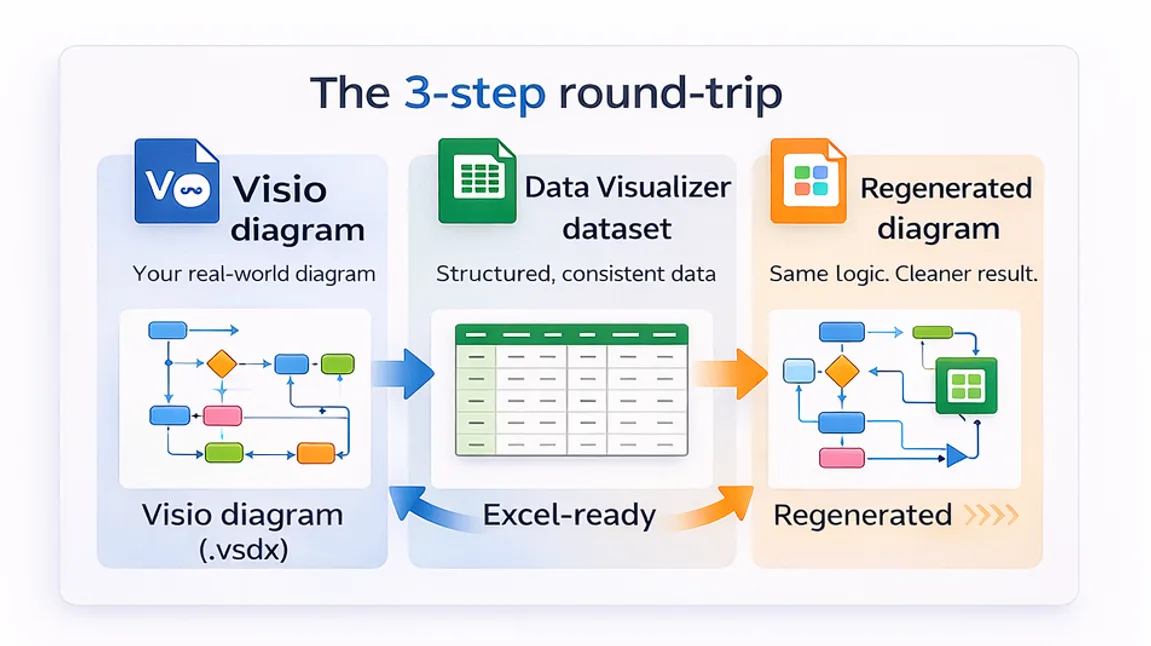
The data-first swimlane method
Most swimlane diagrams fail because updates require opening a diagram and doing manual edits.
A better method is to store the process as a dataset and generate the swimlane diagram from the dataset. That makes the diagram a view, not the system of record.
What the dataset needs
At minimum, each process step is a row with:
| Field | What it controls |
|---|---|
| Process Step ID | Stable identifier for each step. |
| Process Step Description | Text displayed inside the shape. |
| Next Step ID | Connections and branches between steps. |
| Shape Type | Start, process, decision, end, and other allowed types. |
| Function | The swimlane assignment (role/team/system). |
| Phase (optional) | Column/stage assignment if phases are used. |
A simple quick start
- Start with a small real slice of a process (10-20 steps) and capture it as a clean table.
- Use a Data Visualizer-ready template so headers and structure match the importer rules.
- Render the swimlane diagram, then expand the dataset once the format is proven.
Swimlane templates and guides
These swimlane resources are organized as a tight cluster under this hub:
Cross Functional Flowchart
Definition, when to use, and a practical data-first method in Visio.
Open the guideSwimlane Diagram Template
Copy-paste template that matches Visio Data Visualizer field rules.
Get the templateUpdate Swimlane Diagrams Without Redrawing
How to stop doing diagram surgery and start refreshing from a dataset.
Read the methodCross Functional Flowchart Template
Data Visualizer-ready template focused on cross-team handoffs.
Open the templateCross Functional Dataset Example
Example dataset that renders a cross functional flowchart.
View the exampleSwimlane Diagram Examples
Common patterns for approvals, rework loops, and customer intake processes.
Browse examplesSwimlane Flowchart
Clarify the “swimlane flowchart” term and how it maps to the Data Visualizer format.
Read the guideVisio Swimlane Diagram
How to build and maintain swimlanes in Visio with fewer redraws.
Open the tutorialCommon mistakes that make diagrams useless
- Lane drift: the same team appears as 3 lanes (Ops vs Operations vs Operations Team).
- Redraw dependency: every change requires manual shape movement and connector repair.
- Too many lanes: the diagram becomes unreadable and nobody can explain what matters.
- Handoffs hidden: lanes are too generic, so the real handoff delays are invisible.
- No stable identifiers: without step IDs, updates and analysis become chaos.
FAQ
What is a swimlane diagram?
A swimlane diagram is a flowchart where each step is assigned to a lane that represents a role, team, department, or system. It clarifies ownership and makes handoffs visible.
Is a swimlane diagram the same as a cross functional flowchart?
In most business contexts, yes. “Cross functional flowchart” is a common name for a swimlane diagram used to show how work moves across teams.
What is the fastest way to keep a swimlane diagram updated?
Maintain the process as a dataset and regenerate the diagram from the dataset. Updates become table edits instead of manual diagram edits.
How many swimlanes should be used?
Use the fewest lanes that still make ownership and handoffs visible. If lanes become too granular, the diagram becomes unreadable. Start broad, then split lanes only where decisions depend on that distinction.
Can Visio generate swimlane diagrams from data?
Yes. Visio Data Visualizer can render a cross functional flowchart from a strict dataset format (commonly TSV exported from Excel). Function typically controls swimlanes, and Phase can control columns when used.
Why do Data Visualizer imports fail?
The importer is strict. Common causes include mismatched headers, blank lines, step IDs referenced in Next Step IDs that do not exist, and inconsistent use of shape type values.
Want a faster path? Start with the Lite download to generate a clean, Data Visualizer-ready dataset. Upgrade to Standard when the process needs more steps and reusable workflows.
Microsoft Visio is a trademark of Microsoft. No affiliation or endorsement is implied.


