
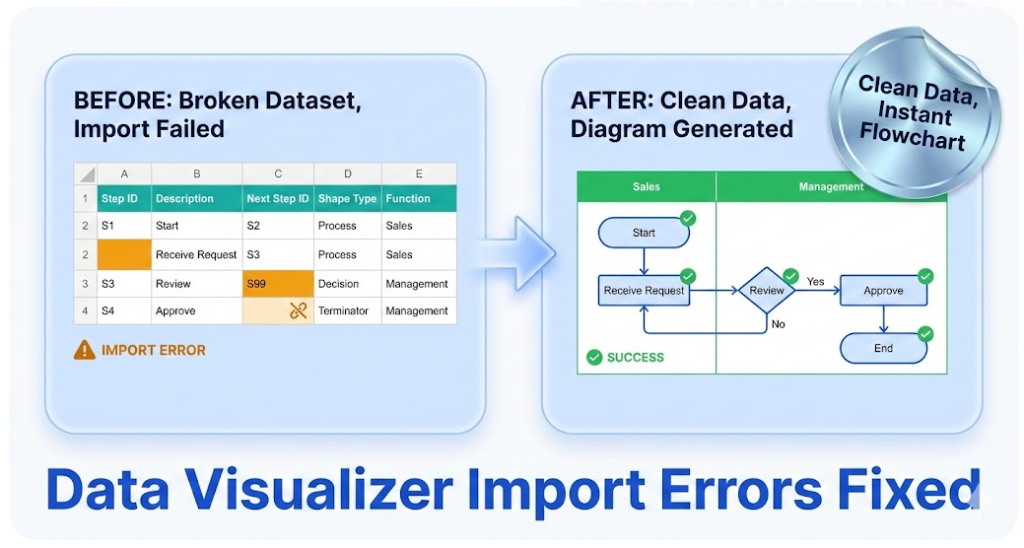
Data Visualizer Import Troubleshooting
Import errors almost always mean one thing: the dataset is not internally consistent. The good news is that dataset problems are faster to diagnose than diagram problems—if the workflow is strict.
This page helps isolate the failing row(s), fix the root cause, and get back to refreshable diagrams.
Related pages: Dataset format · Convert diagram to Excel (diagram → dataset) · Swimlane diagrams hub
Quick diagnosis table (symptom → cause → fix)
| Symptom | Likely cause | Fix |
|---|---|---|
| Import fails immediately | Duplicate Process Step ID | Make IDs unique. Keep IDs stable over time (change text, not IDs). |
| Broken connectors / missing steps | Next Step ID references a non-existent ID | Add the missing step or correct the reference. Validate every Next Step ID. |
| Shapes missing or wrong shapes | Invalid Shape Type values | Use only allowed shape types for the template being imported into. |
| Cross-functional flowchart looks scrambled | Inconsistent Function (lane) / Phase values | Standardize naming. Eliminate near-duplicates (e.g., “Finance” vs “Fin”). |
| Branching behaves oddly | Branching formatted incorrectly in Next Step ID | Store multiple next IDs as comma-separated IDs in one cell (no spaces). Ensure each branch points to a real step. |
| “It works for small imports but not full size” | A single hidden bad row | Use the isolation method below to pinpoint the failing row quickly. |
Two rules prevent most failures: (1) no blank rows in tab-separated values (TSV), including a blank line at the end of the file, and (2) every Next Step ID must exist as a Process Step ID.
Fastest way to isolate the bad row (binary split)
When a dataset is large, finding the failing row by scanning is slow. The fastest method is a simple split-and-test approach:
- Confirm a known-good import works. Start with a working example dataset, then import your dataset.
- Split the dataset in half. Import the first half.
- If the first half imports, the problem is in the second half. If it fails, the problem is in the first half.
- Repeat until the failing set is small (often 10–30 rows).
- Fix the failing rows, then import the full dataset.
Need a clean starting dataset? Use: cross functional flowchart dataset example and swimlane template.
Excel checks you can run in minutes
1) Duplicate ID check
Create a helper column and use a COUNTIF check. Any value greater than 1 is a duplicate ID.
=COUNTIF([Process Step ID],[@[Process Step ID]])2) Missing Next Step reference check
For single Next Step IDs, a MATCH check catches broken references:
=ISNUMBER(MATCH([@[Next Step ID]],[Process Step ID],0))If branching is stored as multiple IDs (example: 070,080), split the cell first (Text to Columns or a helper formula) before validating each branch.
3) Lane and phase normalization check
Create a unique list of Function values (lane labels) and Phase values, then scan for near-duplicates caused by spacing, abbreviations, or typos.
Branching mistakes (the most common “looks right” failure)
Branching should not be modeled as extra rows. A decision step branches by listing multiple next IDs in one cell:
Process Step ID        Process Step Description        Next Step ID        Shape Type        Function
060        Request complete?        070,080        Decision        Coordinator
Important: use commas with no spaces: 070,080 (not 070, 080).
Lane/phase drift (why the diagram looks scrambled)
If the diagram imports but the layout looks chaotic, the dataset is usually inconsistent in these fields:
- Function: lane owner (role/team/department/system)
- Phase: stage/column grouping (optional)
Standardize values before importing. Treat these columns like controlled vocabulary, not free text.
If it still won’t import
- Compare your headers and allowed values against dataset format.
- Try importing a smaller dataset (10–20 rows) and then expanding.
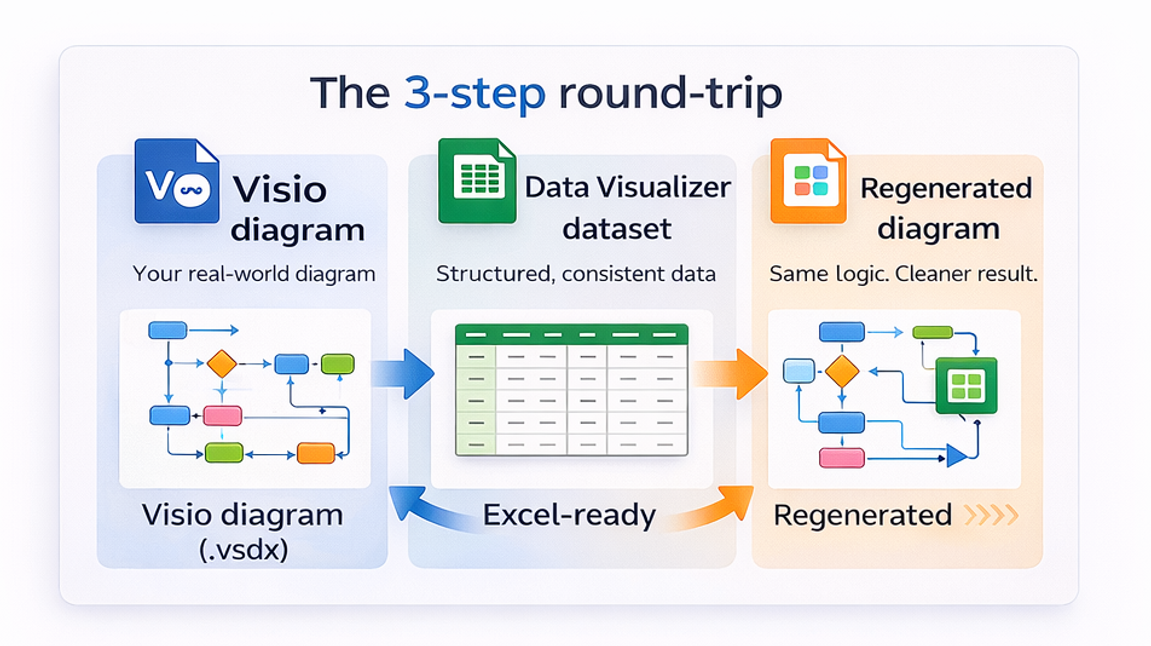
- If the main goal is exporting a real diagram to Excel before importing back into Visio, start here: Convert a Visio diagram to Excel (diagram → dataset).
FAQ
What is the most common cause of Data Visualizer import failure?
Duplicate Process Step IDs and Next Step IDs that reference missing steps are the most common. Blank rows in TSV are another frequent hidden cause.
Why does the diagram import but look scrambled?
Inconsistent Function (lane) and Phase values usually cause layout instability. Standardize naming and eliminate near-duplicates.
How should decision branching be represented?
Store multiple Next Step IDs in one cell as comma-separated IDs with no spaces (example: 070,080). Ensure each ID exists as a Process Step ID.
Is there a fast way to find the failing row?
Yes. Split the dataset and import halves until the failing set is small. This “binary split” approach is often the fastest method for large datasets.
What is the fastest way to validate the workflow before upgrading?
Use Lite (Free, 20 steps) to generate a dataset from a real diagram, then validate import and dataset integrity before converting full-size maps.
Fast path: validate the workflow with Lite, then remove the step limit with Standard.
Microsoft, Visio, and Excel are trademarks of Microsoft. This is an independent tool and is not affiliated with Microsoft.


